
|
Getting your Trinity Audio player ready...
|
Bitcoin has support underneath it and a ceiling on top. According to Glassnode’s latest Week On-chain report, published September 30, BTC is holding above the cost bases that rejected it for most of 2026. But ETF demand has cooled, trading volume is thin, and a stack of sell orders at $85K-$85.5K is blocking the way up.
This Bitcoin price analysis breaks down the key on-chain signals, the levels that matter, and what would confirm or break the uptrend.
Bitcoin ETF Inflows Fade After Two $1B Days
US spot Bitcoin ETFs pulled in about $1 billion on September 21 and another $1 billion on September 22. The first of those was the biggest daily haul in almost a year.
The momentum didn’t last. Inflows shrank every trading day afterward, falling to just $24 million on September 28, the latest day in the data, while price drifted sideways.
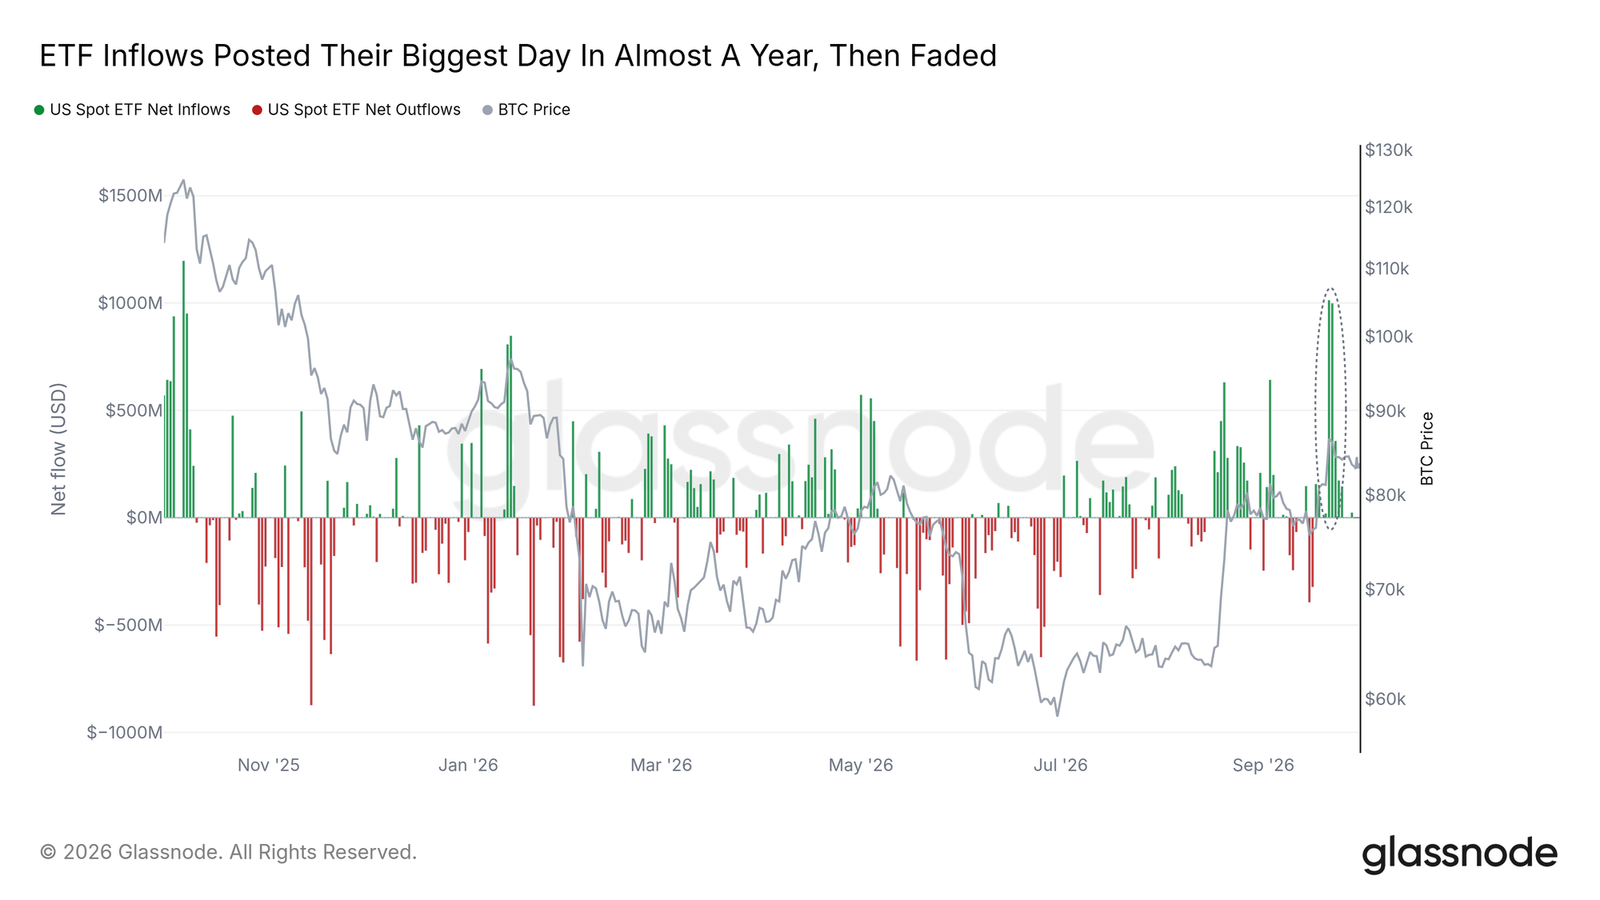
The funds are still buying, but at a fraction of that peak pace. Glassnode flags a return to inflows near $1B a day as the clearest sign that ETF demand is back. Until then, the biggest buyer in the market has gone quiet at a bad moment.
Profit Taking Is Light, but Long-Term Holders Are Selling
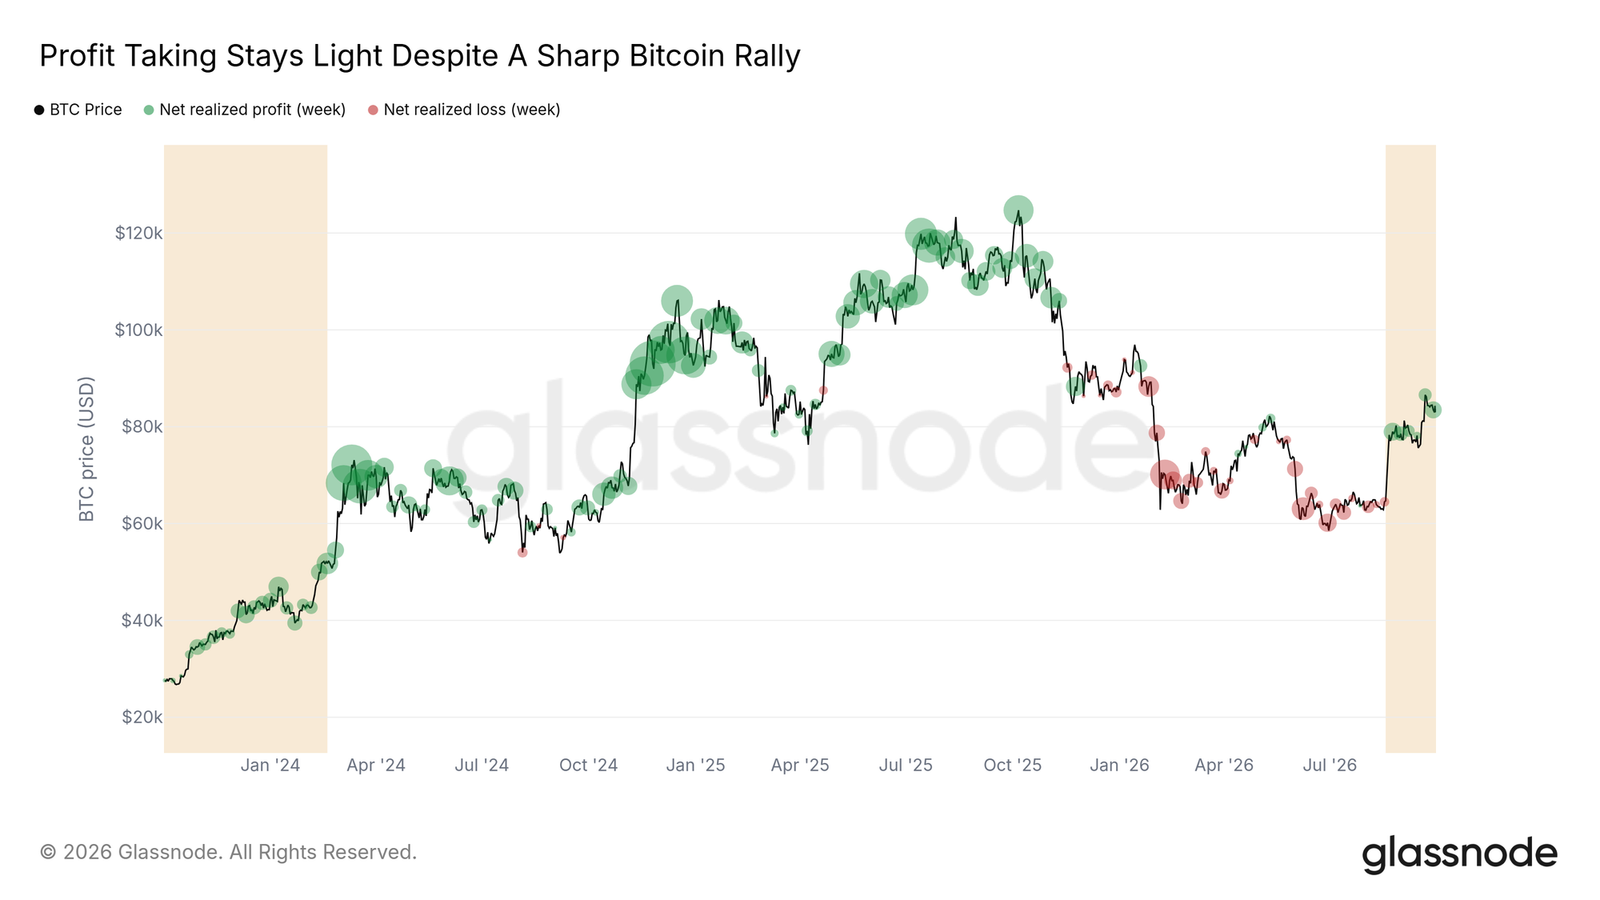
On the surface, selling pressure looks tame. Weekly Net Realized Profit/Loss, which tracks the net dollar gains locked in when coins change hands, runs well below the average week at the 2024 and 2025 tops. The current pace looks more like the early stage of the late-2023 uptrend than a market top.
Under the surface, the sellers have changed. Long-term holders, defined as wallets holding coins for more than 155 days, nearly doubled their realized profit in the week to September 29 compared with the breakout week. Their share of all realized profit jumped from 34% to 55%.
Veterans are distributing into strength. If total weekly profit taking climbs toward past-top levels, that would suggest holders are cashing out in earnest.
Bitcoin vs. the S&P 500: An Edge That’s Slipping
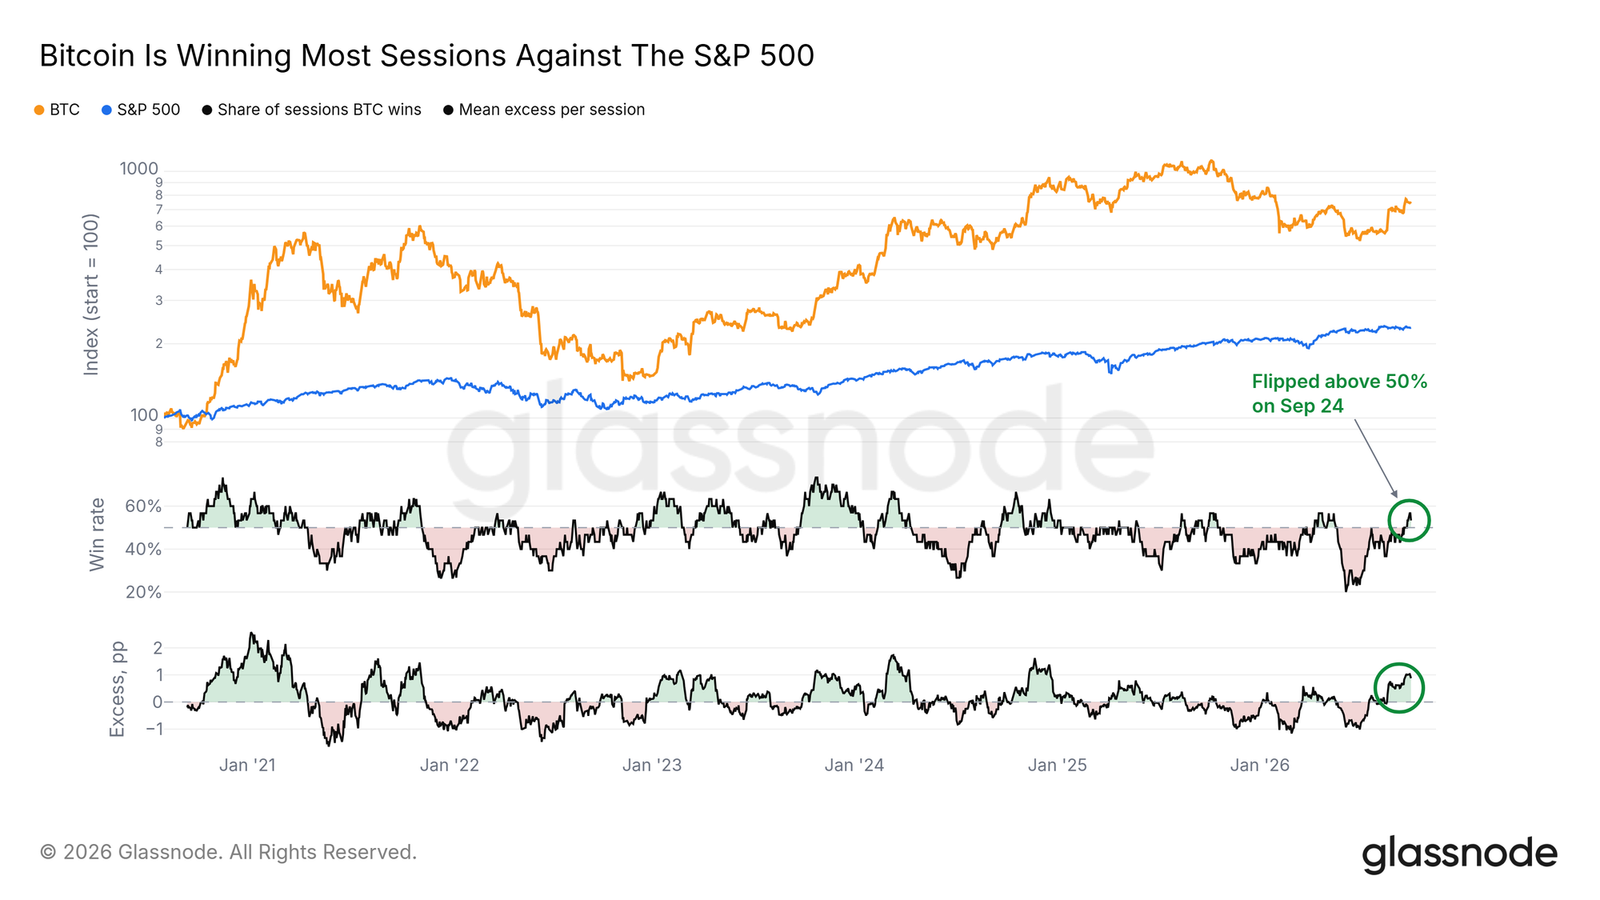
Bitcoin has outperformed US equities over the past 30 sessions. It reacted less to the S&P 500’s down days than its up days, a pattern that has held since August 20. Its share of winning sessions against the index also moved above 50% on September 24, the first time since mid-May.
This week, the edge wobbled. From September 22 to September 29, Bitcoin dropped 2.9% against a 1.2% decline for the S&P 500, and it fell harder than the index on the index’s down days. The margin is thin, and a few losing sessions would push the win rate back under half. A share that stays above 50% into October would show the outperformance is more than a short streak.
The $85K Sell Wall: Bitcoin’s Biggest Resistance
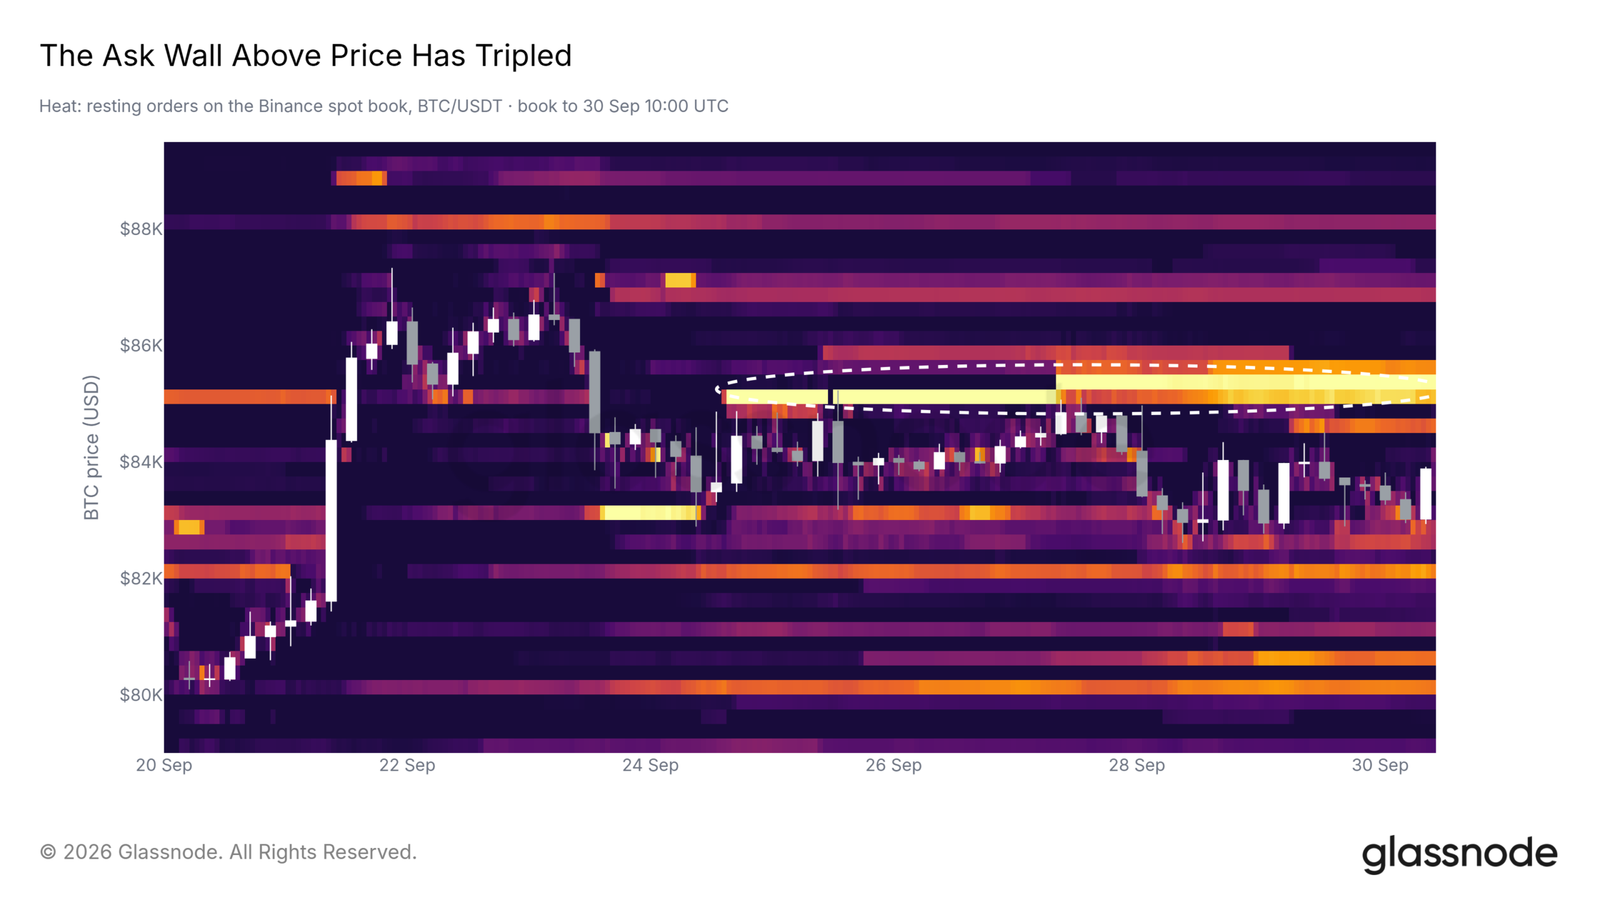
A week earlier, Glassnode named $84K as the level to hold. Price has since slipped just below it, and a large cluster of sell orders on Binance’s spot order book now sits overhead.
The wall spans $85,000 to $85,500. It appeared on September 24 and has roughly tripled in size since. Bitcoin has pushed into the lower half of the zone but hasn’t gotten through.
While those orders stay put, this is the level that matters most. A sustained break above $85.5K would clear the largest resistance on the book.
Bitcoin Support Levels: Where Buyers Defend
Beneath the current price, two on-chain cost bases form the first lines of defense.
Short-Term Holder Cost Basis ($73.3K): This is the average price paid for coins held less than 155 days. Price sits about 13% above it, so recent buyers are in profit. In the 2023 and 2024 uptrends, Bitcoin spent months above this line. A drop back below would push recent buyers underwater again, as they were for most of the first half of 2026.
True Market Mean ($77.2K): This estimates the average price paid by active investors. Bitcoin has held above it since September 18, and it sits roughly 8% below the current price. Glassnode points out that during 2023-2025, stretches above both the True Market Mean and the Short-Term Holder Cost Basis marked the stronger phases of the uptrend. A daily close below $77.2K would end the current streak and be the first real warning sign.
Also Read: Bitcoin Clears Key Technical Level Not Seen Since November
Trading Volume Is Too Low to Trust the Rally
Volume is the weak spot. Total Bitcoin volume, combining spot exchanges and US spot ETFs, averages about $6.4 billion a day. That’s near the bottom of its range since the ETFs launched.
Spot volume has more than doubled from its August low, but that rebound started from a very low base. Glassnode calls the rally early and speculative, with broad demand yet to show up. A sustained rise in volume while price holds above the True Market Mean would signal the uptrend is attracting wider participation.
Altcoins Pause, but Leverage Stays Low
Altcoins have beaten Bitcoin over the past month, with most of the top 500 outperforming BTC over 30 days. That advance stalled this week: only 6% of altcoins sit at a 30-day high, down from 49% on September 22.
Still, the rally hasn’t turned frothy:
- Funding rates are subdued. Just 19% of altcoins pay above the neutral 0.01% perpetual funding rate, far below the share at every past altcoin top on Glassnode’s chart. High funding signals crowded long bets, and that crowding isn’t there.
- Holders are recovering, not euphoric. For the median altcoin, the share of supply in profit has risen from 3% in mid-August to 23%, the sharpest climb in over a year. Most holders remain at a loss, far from the broad profits seen at the 2021 and 2024 peaks.
- Open interest hasn’t built. Altcoin perpetual open interest rose in dollar terms over 30 days but fell when measured in coins. Higher prices drove the gain, not new positions. That keeps the risk of a forced unwind low.
What to Watch Next
Bullish confirmation:
- A sustained break above $85.5K, clearing the sell wall
- Rising volume while price holds above $77.2K
- ETF inflows returning toward the $1B-a-day pace
Bearish warning signs:
- A daily close below the True Market Mean at $77.2K
- Heavier long-term holder selling into a flat price
- Short-term holder cost basis at $73.3K failing as support
Glassnode’s conclusion is that Bitcoin is in an early uptrend that hasn’t yet drawn broad participation. On-chain support is intact, but demand has cooled and the wall overhead is the near-term test.
Frequently Asked Questions
What is the Bitcoin resistance level right now?
According to Glassnode, a wall of sell orders on Binance between $85,000 and $85,500 is the key resistance, and it has tripled in size since appearing September 24.
What is the True Market Mean for Bitcoin?
It’s an estimate of the average price paid by active investors. It currently sits at $77.2K, and Bitcoin has traded above it since September 18.
Are Bitcoin ETFs still buying?
Yes, but at a much slower pace. Daily net inflows dropped from about $1B on September 21 and 22 to $24M on September 28.
Is the altcoin rally overheated?
Not by Glassnode’s measures. Funding rates are modest, only 19% of altcoins pay above-neutral funding, and open interest in coin terms has fallen.
Source: Glassnode, “Strength Meets a Wall,” The Week On-chain, Week 39, 2026. This article is for informational purposes only and is not investment advice.

I’m your translator between the financial Old World and the new frontier of crypto. After a career demystifying economics and markets, I enjoy elucidating crypto – from investment risks to earth-shaking potential. Let’s explore!