
|
Getting your Trinity Audio player ready...
|
Key takeaways
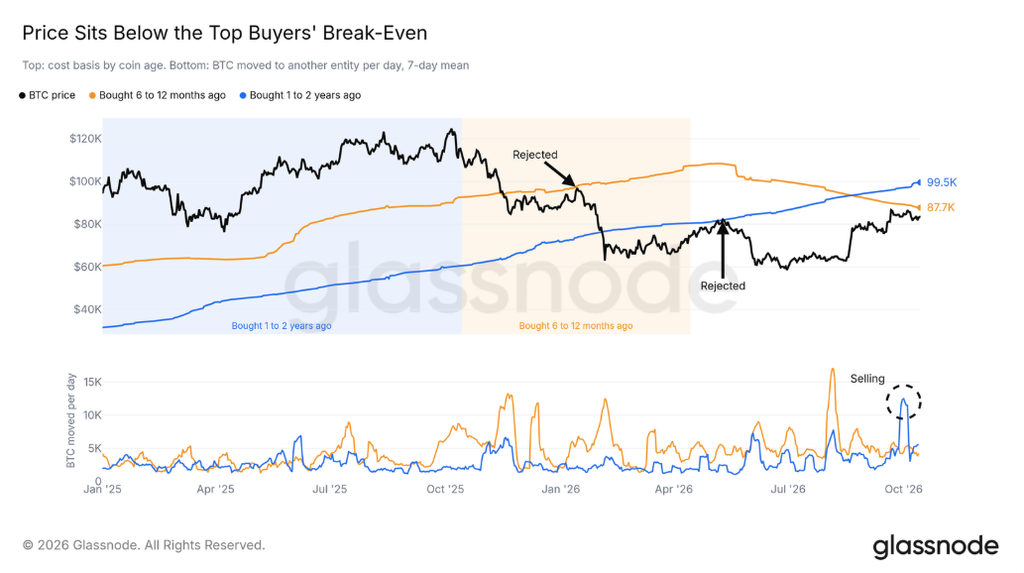
- Glassnode puts the key support zone at $80K-$81.5K (the Binance bid block and the U.S. spot ETF cost basis) and the key resistance at about $88K, where buyers from the past 6-12 months break even.
- Long-term holder losses are down about 85% from their August 12 peak, and holders in profit now outspend holders in loss about four to one.
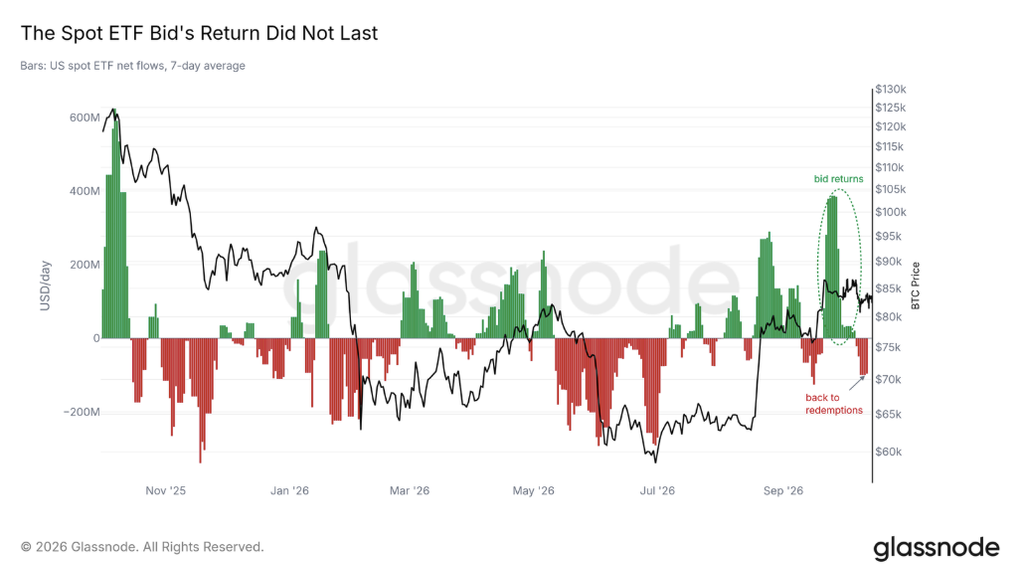
- The ETFs have turned seller again, with about $760M in net outflows since October 7, and a hot CPI print raises the odds of a second Fed hike on October 28.
Bitcoin’s next move comes down to two numbers on Glassnode’s charts: about $81.5K, where the average U.S. spot ETF holder breaks even, and about $88K, where a large group of recent buyers would too. The on-chain firm’s latest weekly report says price is boxed between them, with the ETFs selling again and a hot inflation print adding pressure.
The ceiling: buyers waiting to get out
Glassnode says coins bought six to twelve months ago, during the late 2025 rally and the drop after it, carry a cost basis near $88K. Coins bought one to two years ago sit higher, around $100K. Both lines have already turned price back this year. Bitcoin climbed to the first in January and then fell by more than a third, and it hit the second in May before losing about a quarter. Until Bitcoin closes above $88K, Glassnode argues, each rally meets holders who can sell near break-even.
The floor: where support stacks up
Below price, the picture is sturdier. Bitcoin trades above the True Market Mean, the average cost basis of active investors, near $78K, and has held above it and the short-term holder cost basis since September 18. The U.S. Spot ETF Cost Basis, the average price the funds paid, sits near $81.5K. Bitcoin dipped under it on October 8 and October 13, and both days closed back above. Every daily close since September 21 has held.
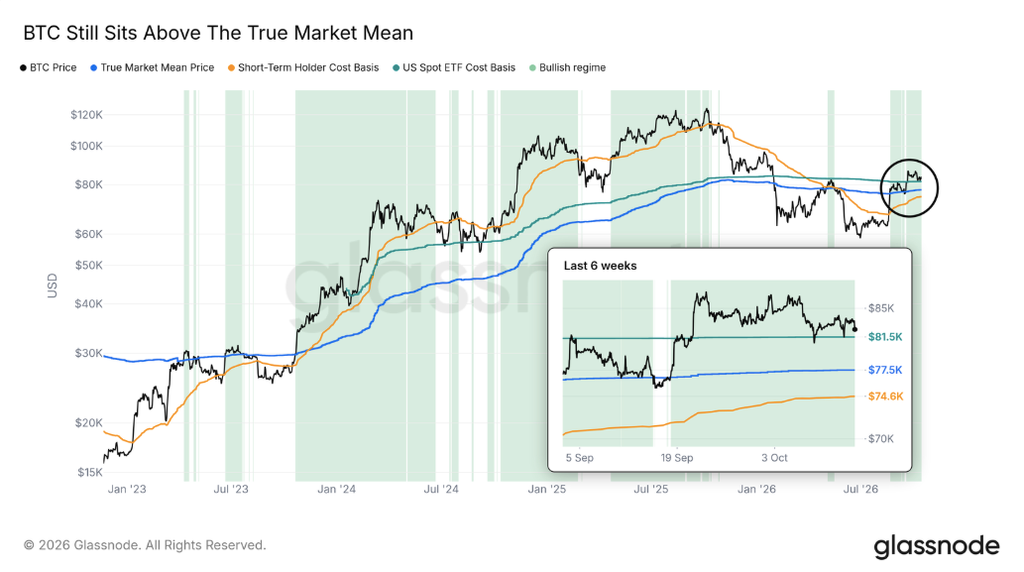
Order books agree. The largest block of Binance bids has gathered at $80K, just under the ETF line. That puts support from on-chain data and order flow in the same zone, $80K to $81.5K. Beneath it, Glassnode flags a liquidation cluster just under $80K, then the True Market Mean.
The sellers who’ve gone quiet
The firm’s most bullish evidence is about who isn’t selling. Long-term holders’ realized losses peaked on August 12 and have dropped about 85% since, and in 2022 the equivalent peak came within weeks of the cycle low. Glassnode’s spending data points the same way. At the June low, coins spent at a loss outnumbered coins spent in profit by roughly twelve to one. The balance flipped in late August, and holders in profit now spend about four coins for every one spent at a loss, a pattern the firm says held in past bull markets.
Its broadest claim is that this bear market never closed below the Realized Price, the average price paid for every coin. In 2018 and 2022, Bitcoin spent months under it. This time the lowest close, on June 30, still sat about a tenth above it.
The weak spot: ETF demand
The ETFs are the problem. They took in nearly $3 billion between September 21 and October 6, their fastest buying since November 2025, as Bitcoin broke above $85K. Since October 7, Glassnode counts about $760 million in net outflows. With ETFs selling and the top buyers near break-even, the firm says little fresh demand sits behind price. A return to steady inflows would be its clearest sign that demand is back.
Macro adds an edge
September’s CPI came in above forecasts, Glassnode reports, with headline inflation at 3.7% and core at 2.6%. Household inflation expectations have pulled further ahead of measured inflation, and the gap is the widest in three years. The report says the Fed raised rates by a quarter point on September 16, its first hike since 2023, and that futures traders have since raised the odds of a second at the meeting ending October 28. The U.S. midterms follow on November 3.
Altcoins: froth in pockets
Glassnode’s froth indicator splits into coin-level and market-wide readings. Coin-level froth has sat in its top fifth since September 28, while market-wide froth is low. That points to crowded leverage in individual coins, which would be most exposed if Bitcoin slid toward $80K.
What to watch
The report’s near-term case is cautious, and its longer-term case is stronger. A daily close above $88K with ETF inflows returning would show demand absorbing the overhead supply. A break of the $80K bids and the ETF cost basis would bring $78K into play. Note that Glassnode doesn’t forecast a direction. It maps where the pressure sits.
Disclaimer: The information in this article is for general purposes only and does not constitute financial advice. The author’s views are personal and may not reflect the views of Chain Affairs. Before making any investment decisions, you should always conduct your own research. Chain Affairs is not responsible for any financial losses.

With a keen eye on the latest trends and developments in the crypto space, I’m dedicated to providing readers with unbiased and insightful coverage of the market. My goal is to help people understand the nuances of cryptocurrencies and make sound investment decisions. I believe that crypto has the potential to revolutionize the way we think about money and finance, and I’m excited to be a part of this unfolding story.