

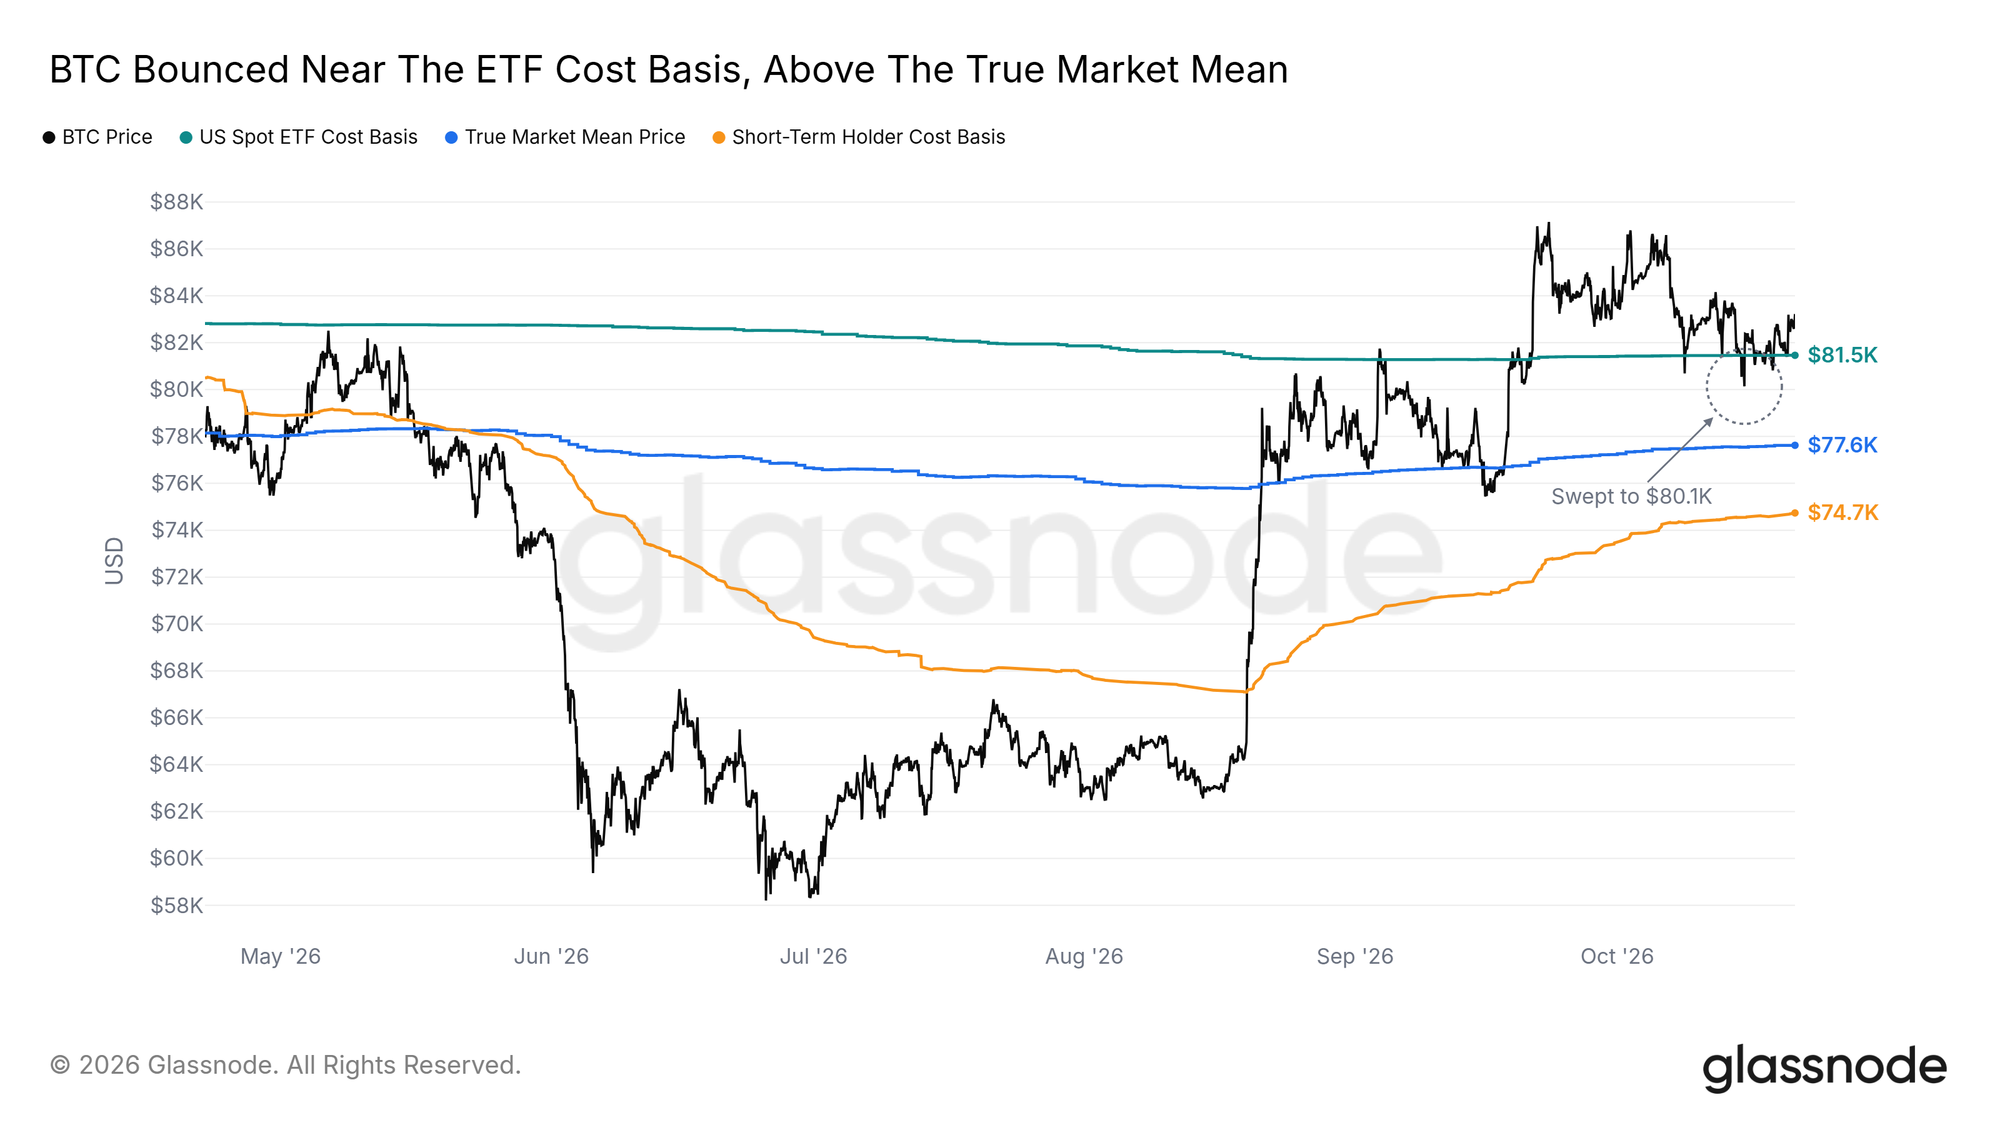
Bitcoin dipped to about $80,000 on October 15, then bounced back within hours. The move hit a zone where two of the market’s biggest buyer groups hold their coins at roughly break-even, and buyers stepped back in. According to Glassnode’s Week 42 on-chain report, the price is still boxed in, with support just below and a thick band of supply above.
Why the $80K Bitcoin Support Level Held
The sweep took the hourly close to $80.1K before the next hour closed back above the line. That level matches the average purchase price of US spot Bitcoin ETFs. Corporate treasury companies hold their coins at a similar cost of about $80.2K. A daily close below $80K would put both groups at a loss on average.
The line has switched roles this year. It capped price in the spring and now acts as a floor. Deeper support sits near $77.6K, the True Market Mean, which tracks the average cost of active investors.
The order book backs this up. A large block of bids at $80K was mostly consumed during the dip, but it had rebuilt by October 20. The bids are smaller than before, yet buyers still want coins at that price.
Bitcoin Resistance Between $85K and $87.5K
Overhead, several barriers cluster together. Coins bought six to twelve months ago have a cost basis near $86.7K. A block of sell orders sits between $86.5K and $87.5K, and the largest liquidation clusters lie near $85K and $87K. A push toward $87K could speed up as short positions are forced closed, but it would run straight into those asks.
Selling pressure is easing. Profit taking has slowed to about half its pace at the September high, and the one-to-two-year holder group now moves under a third as many coins a day as it did at the start of October.
ETF Inflows Return, but Volume Stays Thin
US spot ETFs pulled in about $653 million on October 19, their biggest day since September 22. That flipped the weekly flow positive. Still, the funds traded less than usual that day, and their 30-day average volume is under a quarter of last year’s level. Repeated inflows on rising volume would be a stronger signal.
Treasury companies are not helping much either. Their monthly Bitcoin purchases since June have been under a tenth of the November 2024 peak.
Fed Decision and MSCI Review Are Next
Two dates matter now. The Fed meets on October 28, with oil up roughly 73% this year and the two-year Treasury yield near 4.8%, above the Fed’s target range after September’s hike. A second hike is harder to rule out if inflation expectations keep climbing.
MSCI publishes its final list of excluded non-operating companies on November 11, and Strategy could be on it. Strategy’s shares fell nearly 10% on October 16, the day after MSCI adopted its new rules. A removal would force index-tracking funds to sell, just as treasury buying is already weak.
Also Read: $1 Billion Raised, $250M in Fees: The Brutal Math Behind 100 Crypto Shutdowns
Altcoins Cool Off
Altcoin leverage has eased. The median altcoin fell about 4% over the weekend after the sweep, its largest weekend drop since May. Fewer than 5% of altcoins now pay above-neutral funding, down from nearly a quarter in late September. Open positions are only about 5% below their peak, so crowding could return fast.
Bitcoin sits between $80K support and $87.5K resistance. A daily close above $87.5K, backed by ETF inflows on stronger volume, would signal that demand is absorbing supply. A close below $80K would put the average ETF and treasury holder underwater and bring $77.6K into view.
Disclaimer: The information in this article is for general purposes only and does not constitute financial advice. The author’s views are personal and may not reflect the views of Chain Affairs. Before making any investment decisions, you should always conduct your own research. Chain Affairs is not responsible for any financial losses.

I’m your translator between the financial Old World and the new frontier of crypto. After a career demystifying economics and markets, I enjoy elucidating crypto – from investment risks to earth-shaking potential. Let’s explore!