
|
Getting your Trinity Audio player ready...
|
Key Takeaways:
- XRP is testing critical resistance between $1.50-$1.60, with a weekly close above $1.60 needed to open the path toward $1.80-$2.00.
- Failure to hold this zone keeps a Q4 retracement scenario in play, though no specific downside target has been confirmed.
- XRP’s monthly RSI is in a range seen before two past major rallies, but the confirming crossover above its moving average hasn’t happened yet.
XRP is stuck at a price level that could decide its next several weeks. The token is currently testing a resistance zone between roughly $1.50 and $1.60, and depending on how it behaves here, chart watchers say the next move could either be a pullback deeper into the fourth quarter or a run toward $2.
Analyst ChartNerd broke down the setup on X, pointing to two distinct paths that hinge almost entirely on whether XRP can hold above this narrow band. Right now, the token sits close to $1.5625, just above its 50-week exponential moving average near $1.5238 — a gap of only about 2.5%. That’s a thin margin separating two very different outcomes.

Why $1.60 Is the Line in the Sand
The first scenario plays out if XRP can’t manage a sustained weekly close above $1.60. If that resistance holds, the broader corrective pattern that’s defined recent months would stay intact, and price could slide back toward lower support sometime during Q4. No specific downside target has been mapped out for that scenario — it’s more about the structure staying weak than a precise number to watch.
The more bullish path requires XRP to actually break through and hold above this zone. From current levels, a move to $1.80 would represent about a 15% gain, while reaching $2 would mean roughly a 28% climb. That $2 level isn’t arbitrary — it lined up with a support zone that held throughout 2025, so a push back to that area would essentially be XRP retesting old ground from the other direction before any further pullback.
A Longer-Term Signal Worth Watching
Beyond the weekly chart, there’s a slower-moving signal in play on the monthly timeframe. XRP’s monthly RSI has dropped into a range that has, historically, shown up right before two of the token’s largest rallies. In both prior instances, RSI fell into this same zone before turning higher and eventually crossing back above its own moving average — a shift that tends to mark renewed upward momentum.
Right now, RSI has only just started ticking up and remains below that moving average, meaning the setup isn’t confirmed yet. It’s a similar shape to what came before past rallies, but the key trigger — the actual crossover — hasn’t happened.
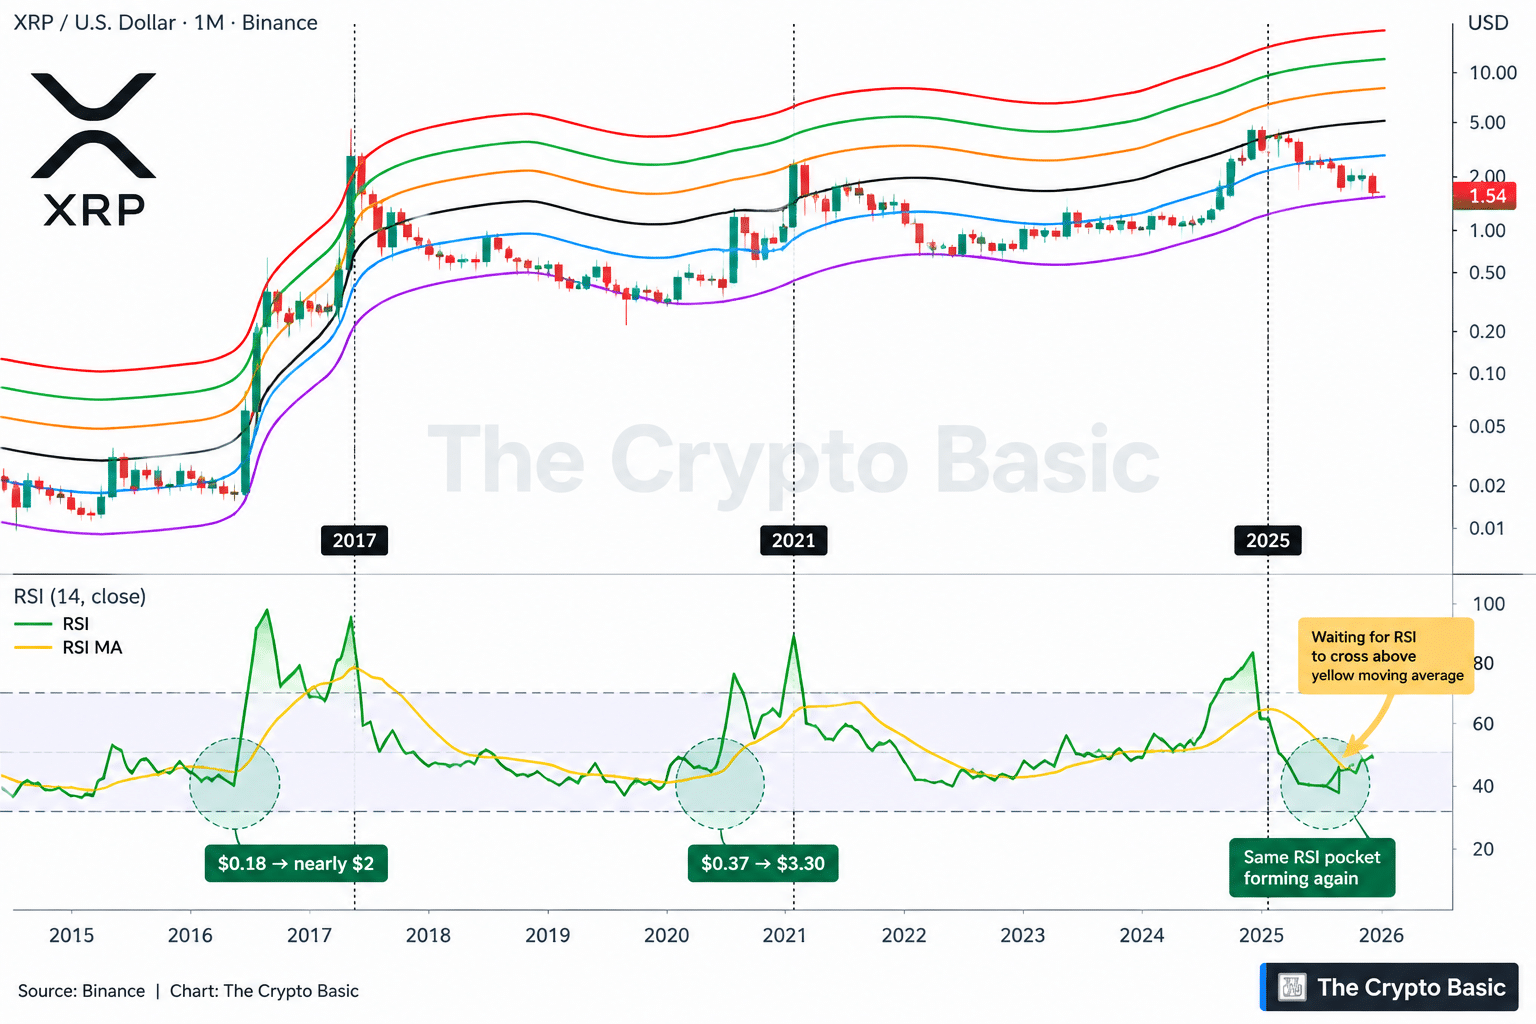
For context on scale rather than prediction, the earlier rallies saw XRP move roughly 11x and 9x from their starting points. Applied purely as math to today’s price, that would put XRP somewhere between $13 and $17. That’s not a forecast — it’s simply what those historical ratios would look like applied to the current price, and past rallies unfolded under very different market conditions.
Also Read: XRP Just Completed a 7-Year Retest — Here’s Why It Matters
What to Watch Next
For now, XRP is sitting exactly where it needs to be for either outcome to unfold. The near-term path depends on a weekly close above or below $1.60, while the longer-term momentum question depends on whether that monthly RSI crossover eventually confirms. Neither has happened yet, which means patience — not prediction — is the name of the game here.
Disclaimer: The information in this article is for general purposes only and does not constitute financial advice. The author’s views are personal and may not reflect the views of Chain Affairs. Before making any investment decisions, you should always conduct your own research. Chain Affairs is not responsible for any financial losses.