
|
Getting your Trinity Audio player ready...
|
Key Takeaways:
- SUI has broken out of a months-long symmetrical triangle, now trending bullish.
- Key resistance zones lie at $5.86, $7.30, and $8.59 per Fibonacci extensions.
- $3.60 remains a critical support level for the bullish continuation setup.
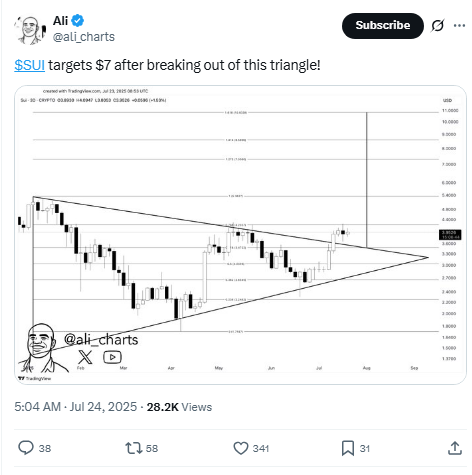
SUI has confirmed a major bullish breakout, breaking free from a multi-month symmetrical triangle and now aiming for a potential rally toward $7.00. As of July 24, 2025, the price trades at $3.95, gaining +1.53% on the 3-day chart. Prominent analyst Ali (@ali_charts) validated the breakout using Fibonacci extension tools, projecting strong upside ahead.
Technical Breakout Above Triangle Confirms Bullish Reversal
The symmetrical triangle formed from February to mid-July, with SUI trading between $2.40 and $4.20. After consolidating within narrowing support and resistance levels, the price finally broke above $3.60—marking a decisive breakout and potential trend reversal from this year’s earlier downtrend.
This breakout coincided with strong structural support from an ascending trendline that began forming in March. With this upward move, SUI has now invalidated its prior bearish structure, setting up for a bullish phase.
Fibonacci Levels Highlight $7.30 and $8.59 as Key Targets
Fibonacci retracement and extension levels offer important insight into where SUI may be heading. The price has already cleared both the 0.618 retracement ($3.03) and the 0.786 level ($4.20), showing technical strength.
According to Ali’s analysis, the 1.414 Fibonacci extension sits near $5.86—a zone that could provide near-term resistance. A successful breakout above this region opens the path to $7.30 (1.272 extension) and possibly $8.59 (1.618 level). These projections underscore the upside potential if momentum continues.
$3.60 Retest Acts as Crucial Support Zone
Following its surge, SUI retested the breakout area around $3.60. Price action has held above this key level, suggesting that support has been validated. Bullish candlestick formations continue to print higher highs and higher lows—strengthening the case for upward continuation.
Traders and social media users are closely monitoring the $3.60 zone. User @333blacks noted the successful retest appears underway, keeping SUI in the spotlight as one of the few altcoins outperforming in the current market.
Also Read: Sui Gains Speed, MUTM Eyes 1000% Presale Surge
The technical picture remains bullish for SUI as long as the $3.60 support holds. With volume slightly increasing and strong confirmation from Fibonacci analysis, the path to $7.00 appears structurally sound. Any close above $5.86 would further solidify bullish sentiment.
While a failure to hold support could trigger consolidation, the current momentum, volume, and chart structure all favor a continued rally.
Disclaimer: The information in this article is for general purposes only and does not constitute financial advice. The author’s views are personal and may not reflect the views of Chain Affairs. Before making any investment decisions, you should always conduct your own research. Chain Affairs is not responsible for any financial losses

I’m a crypto enthusiast with a background in finance. I’m fascinated by the potential of crypto to disrupt traditional financial systems. I’m always on the lookout for new and innovative projects in the space. I believe that crypto has the potential to create a more equitable and inclusive financial system.