|
Getting your Trinity Audio player ready...
|
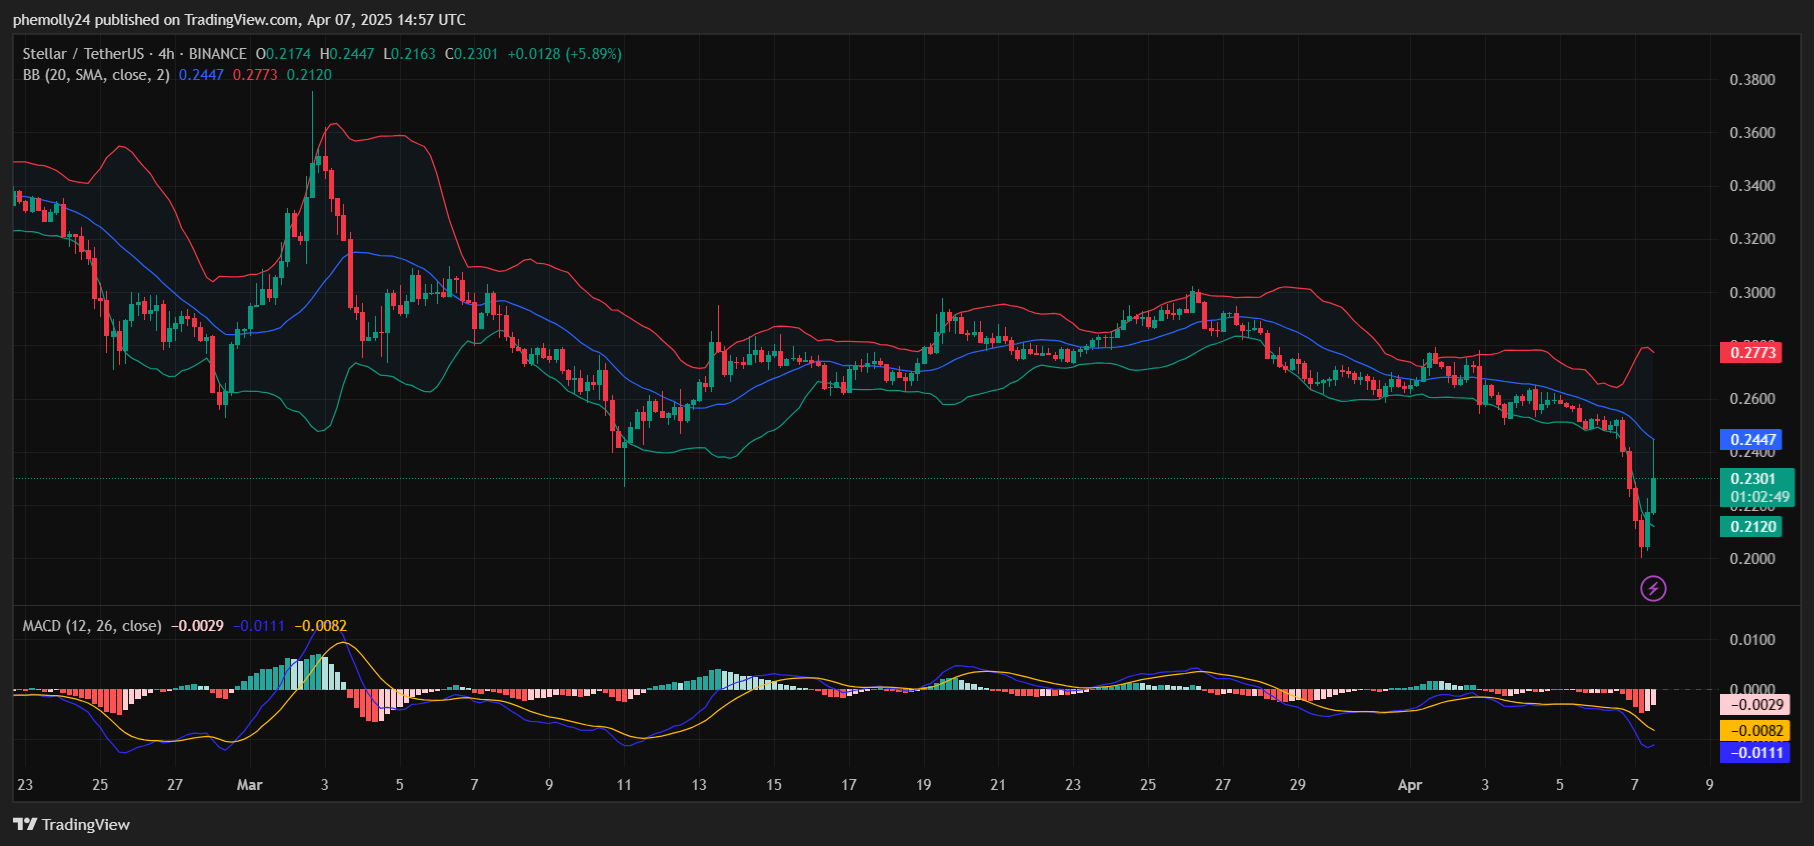
Stellar (XLM) has been on a prolonged downtrend, recently reaching new local lows as bearish momentum intensifies. Over the past 10 weeks, XLM has steadily declined, with its latest technical structure indicating growing weakness. Currently trading at $0.2312, XLM is down nearly 4%, and several signals across various timeframes suggest further downside potential.
Key Price Patterns
Descending Triangle (Daily)
The daily chart reveals a clear descending triangle pattern. Since late February, XLM has been forming lower highs with flat support around $0.22–$0.23. A daily close below this level would confirm a breakdown, with potential targets near $0.18 or lower.
Head and Shoulders (4H)
On the 4-hour chart, XLM formed a bearish head and shoulders pattern in late March, with a neckline break around $0.24. This breakdown has since been validated, confirming a bearish continuation.
Bear Flag (1H/15M)
In shorter timeframes like the 1-hour and 15-minute charts, minor bear flags are visible. These consolidations within a downward channel often precede further selling, aligning with the overall bearish momentum.
Technical Indicators
Bollinger Bands (20 SMA)
Price action is hugging the lower Bollinger Band, signaling strong bearish volatility. As the bands widen, this typically precedes trend acceleration, with price repeatedly rejecting the mid-band on lower timeframes.
MACD (12, 26)
The daily MACD has crossed below the signal line, deepening the red histogram. This bearish crossover is confirmed on both the 4-hour and 1-hour charts, with no signs of bullish divergence to suggest a reversal.
RSI
The daily RSI is nearing 30, indicating oversold conditions, but there is no reversal signal yet. Both the 4-hour and 1-hour RSI remain below 40, reinforcing the bearish bias.
Volume and Key Levels
Volume
Bearish volume has been rising on down days, while minor bounces show fading volume. This bearish volume profile suggests that XLM will struggle to recover without a significant surge in buy volume.
Key Levels to Watch
Immediate support lies at $0.2120 and $0.1980, while resistance is at $0.2290, $0.2460, and $0.2690. A breakout above $0.2750 would invalidate the bearish scenario, while the breakdown target rests between $0.1800 and $0.1650.
Also Read: Stellar Lumens (XLM) Price Analysis: Key Support and Resistance Levels
Without significant bullish intervention at the $0.2120 support level, XLM may continue its descent toward the $0.18 zone. A short-term relief rally could test resistance between $0.2290 and $0.2460, but unless $0.27 is reclaimed, the bearish structure is likely to persist. As the broader market sentiment remains risk-averse, XLM’s price action faces significant headwinds.

Disclaimer: The information in this article is for general purposes only and does not constitute financial advice. The author’s views are personal and may not reflect the views of Chain Affairs. Before making any investment decisions, you should always conduct your own research. Chain Affairs is not responsible for any financial losses.
I’m your translator between the financial Old World and the new frontier of crypto. After a career demystifying economics and markets, I enjoy elucidating crypto – from investment risks to earth-shaking potential. Let’s explore!