|
Getting your Trinity Audio player ready...
|
- DOT is holding above a critical weekly support zone despite recent volatility.
- RSI and MACD indicators are both signaling improving bullish momentum.
- Traders are closely watching the $1.36 resistance level for confirmation of a breakout.
Polkadot is showing early signs of recovery after weeks of price weakness, with traders closely watching whether the token can sustain momentum above a major support zone. Technical indicators are beginning to shift in favor of buyers, raising expectations that DOT could attempt another move higher in the near term.
At the time of writing, Polkadot was trading at $1.31, down slightly over the past 24 hours. Despite the minor pullback, market activity remained strong, with daily trading volume reaching nearly $210 million and market capitalization holding above $2.2 billion.
The recent stabilization has encouraged traders who believe the asset may be forming the base for a broader rebound.
Weekly Support Zone Keeps Bulls in Control
Market attention increased after crypto analyst Butterfly highlighted a potentially bullish setup on DOT’s weekly chart. According to the analysis, Polkadot continues to trade above the lower boundary of a descending wedge pattern — a formation often associated with trend reversals when support remains intact.
Buyers appear to be defending the current price region aggressively, helping prevent a deeper breakdown. The ability to maintain support near recent lows has strengthened confidence that downside pressure may be weakening.
DOT has also managed to reclaim short-term moving average levels around $1.25 and $1.27. Holding above those areas could help reinforce positive sentiment and attract additional buying interest.
Technical Indicators Turn Positive
Several technical indicators now suggest momentum is gradually shifting toward the bulls.
The Relative Strength Index (RSI) climbed to 56.42, moving above the neutral 50 level. This change typically signals improving market strength and rising buying activity after a period of weakness.
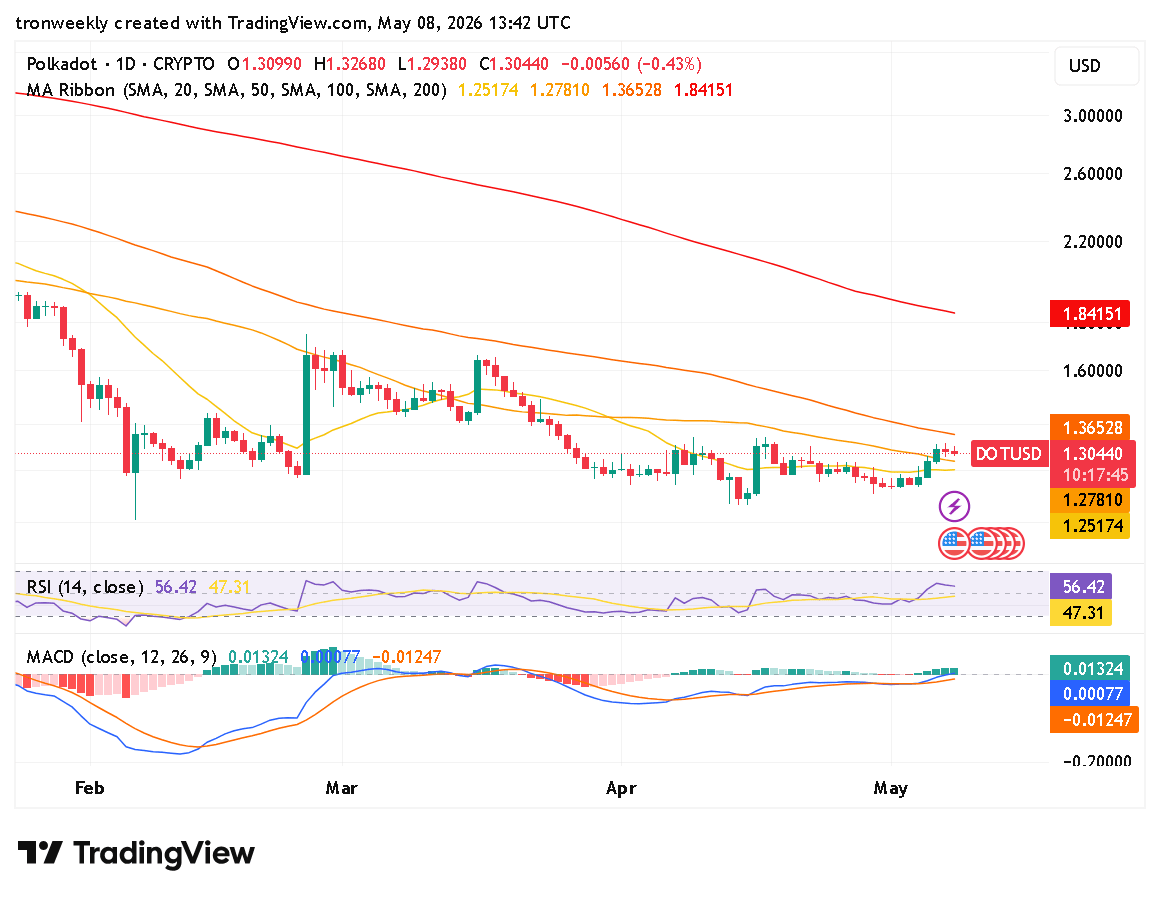
At the same time, the MACD indicator has crossed into bullish territory. The MACD line currently sits above the signal line, while the histogram remains positive — both signs that upward momentum may continue building.
Together, these indicators suggest that traders are becoming more confident in the possibility of a short-term recovery.
Can DOT Break the Next Resistance Level?
The next major level traders are watching sits near $1.36, which aligns with the 100-day simple moving average. A decisive move above that resistance could confirm stronger bullish momentum and potentially open the door for further gains.
Also Read: Polkadot Nears $1.60 Breakout as Bullish Bets Double Shorts — What’s Next?
However, analysts caution that maintaining support remains critical. If buying pressure weakens, DOT could still face renewed volatility in the broader crypto market.
For now, Polkadot appears to be regaining stability, with technical signals offering cautious optimism for investors looking for signs of a sustained recovery.
Disclaimer: The information in this article is for general purposes only and does not constitute financial advice. The author’s views are personal and may not reflect the views of Chain Affairs. Before making any investment decisions, you should always conduct your own research. Chain Affairs is not responsible for any financial losses.
I’m your translator between the financial Old World and the new frontier of crypto. After a career demystifying economics and markets, I enjoy elucidating crypto – from investment risks to earth-shaking potential. Let’s explore!