

|
Getting your Trinity Audio player ready...
|
Bitcoin has plunged below $89,500, sending shockwaves across the crypto market, with analysts predicting a potential 10% further decline. However, despite short-term bearish signals, long-term bullish indicators suggest that the Bitcoin rally may not be over yet.
Market Sentiment Turns Bearish
The recent decline in Bitcoin’s price coincides with heightened macroeconomic uncertainty. U.S. President Donald Trump has reignited trade tensions by imposing a 25% tariff on Canada and Mexico, triggering sell-offs in both the stock and crypto markets. The global crypto market capitalization has dropped below $3 trillion, intensifying fears of a prolonged downturn.
Bitcoin’s plunge to $89,000 marks its lowest level since November 2024. The Fear & Greed Index has dropped to 25, reflecting extreme fear, a level reminiscent of the FTX collapse. Adding to concerns, BTC’s daily chart indicates a breakdown below the neckline of a double-top pattern, signaling a possible deeper retracement.

Will Bitcoin Drop Below $85,000?
Technical indicators suggest further downside potential. The Gaussian channel, which remained bullish since October 2024, has turned bearish. Meanwhile, the Relative Strength Index (RSI) is nearing oversold territory, a level not seen since August 2023. If selling pressure persists, Bitcoin could test support near $80,000.
Furthermore, Bitcoin is trading close to the support of a descending parallel channel, a structure similar to early 2024, when BTC dipped below $54,000 before skyrocketing to a new all-time high (ATH) above $109,000. If history repeats itself, a recovery from support near $85,000 could set the stage for another bullish phase.
Is the Bitcoin Bull Run Over?
Despite bearish short-term trends, long-term projections remain optimistic. BTC continues to exhibit patterns that have historically preceded strong rebounds. The weekly Moving Average Convergence Divergence (MACD) indicator still resides in a positive range, suggesting that selling pressure could soon subside.
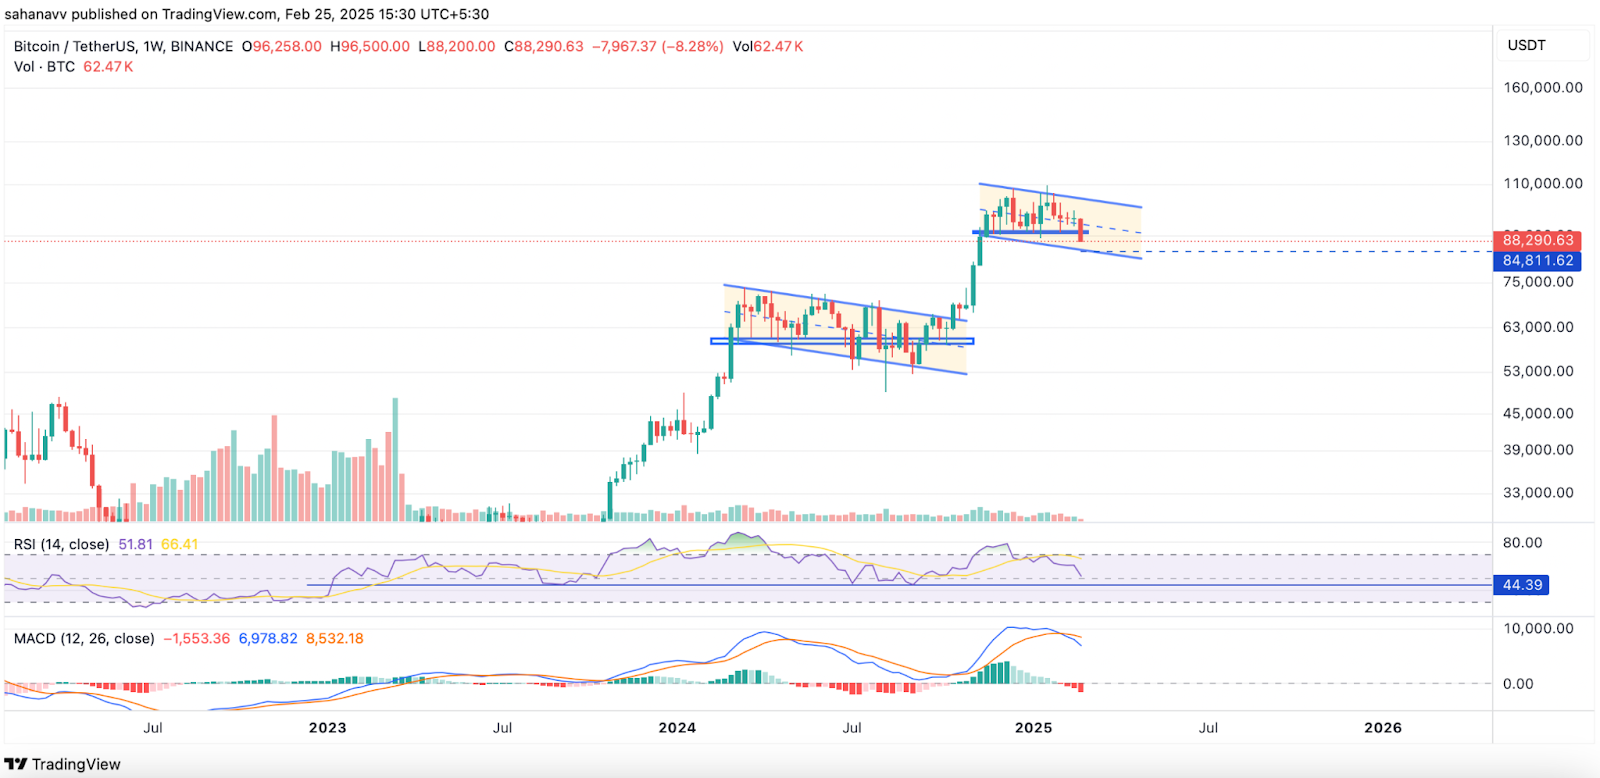
If Bitcoin reclaims momentum and breaks above the descending channel, a fresh rally could be in play. A breakout beyond key resistance could propel BTC toward a new ATH above $112,000.
While bearish forces dominate the short-term landscape, historical trends and technical indicators suggest that Bitcoin’s bull run may not be over just yet. The coming weeks will be critical in determining whether BTC can regain its bullish momentum or if deeper corrections lie ahead.
Also Read: Bitcoin at Risk: Analysts Warn of Drop to $81K Amid ETF Sell-Off
Disclaimer: The information in this article is for general purposes only and does not constitute financial advice. The author’s views are personal and may not reflect the views of Chain Affairs. Before making any investment decisions, you should always conduct your own research. Chain Affairs is not responsible for any financial losses.

I’m a crypto enthusiast with a background in finance. I’m fascinated by the potential of crypto to disrupt traditional financial systems. I’m always on the lookout for new and innovative projects in the space. I believe that crypto has the potential to create a more equitable and inclusive financial system.