|
Getting your Trinity Audio player ready...
|
Solana (SOL) is facing strong resistance near the $144 mark as investor sentiment shifts, according to on-chain data. Glassnode reports that nearly 27 million SOL last moved between $144 and $156, solidifying this as a key resistance zone. Another 26.6 million SOL changed hands between $132 and $144, forming a dense supply cluster that could impact price movement.
Selling Pressure Dominates Resistance Levels
With a large number of traders holding SOL at these prices, selling pressure intensifies as the token revisits these levels. Between March 19-31, Solana’s supply data reflected a pattern of profit-taking and reaccumulation.
Glassnode’s data revealed a 0.3% increase in SOL moved at $144.54, while holdings at $147.49 dropped by 0.1%, signaling reduced conviction at recent highs. Investors seem to be rotating into lower price zones, reinforcing support between $123 and $144.
Between Mar 19 and Mar 31, the share of $SOL supply last moved at:
— glassnode (@glassnode) April 1, 2025
🟣$123.89 rose from 3.69% to 3.73%
🟣$144.54 rose from 4.2% to 4.5%
🟣$147.49 fell from 2.08% to 1.98%
This suggests some profit-taking or distribution near recent highs, with supply migrating into lower cost… https://t.co/WEknpNF77N pic.twitter.com/STW2nMfhHb
Notably, accumulation has risen near $112, where holdings more than doubled from 4 million to 9.7 million SOL since January, reflecting a recalibration of key support and resistance levels.
Can Solana’s Support Hold?
A strong support zone has emerged between $94 and $100, where over 21 million SOL—roughly 3.5% of the supply—last changed hands. This area could serve as a buffer in case of further declines.
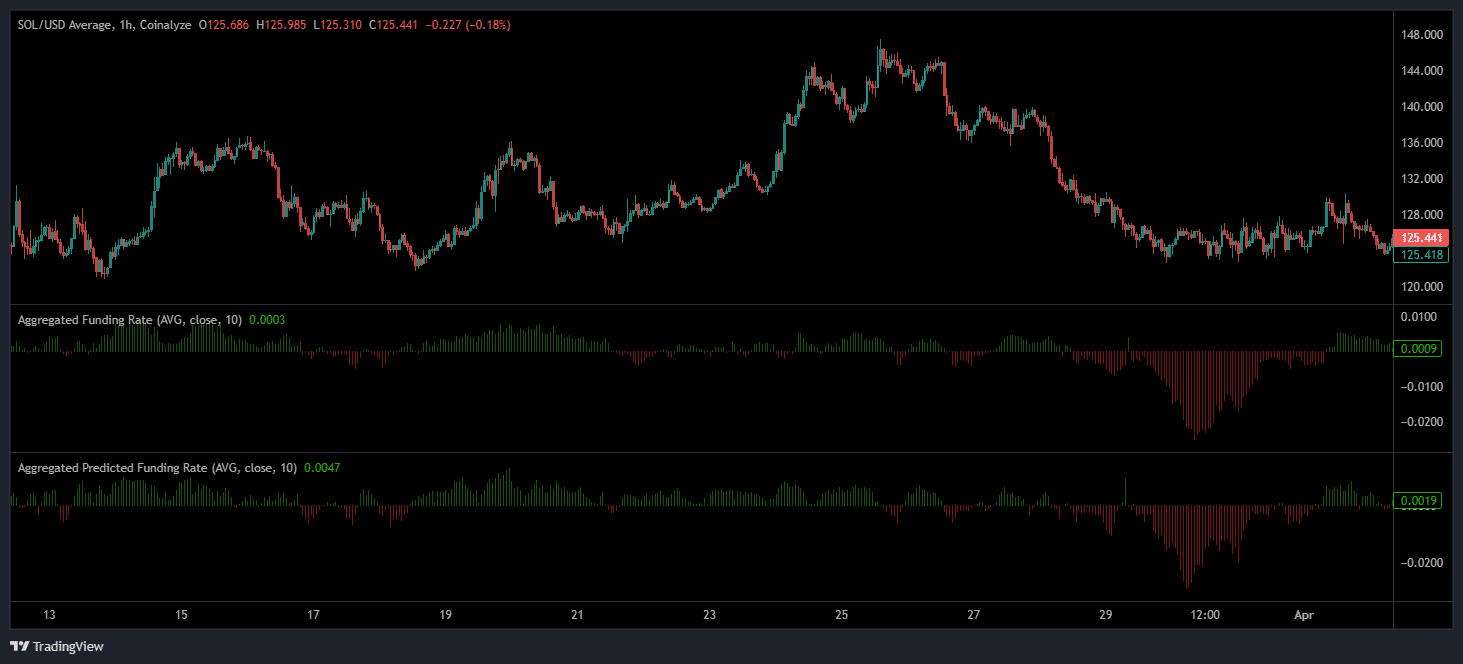
Funding rate trends also indicate shifting trader sentiment. From March 18-24, SOL surged from $120 to over $140, with funding rates peaking at +0.0035 as long positions increased. However, after March 25, the altcoin’s price dropped to $125, turning funding rates negative, hitting lows of -0.0047—suggesting a bearish shift in expectations.
Market Consolidation Before the Next Move?
Liquidation data reinforces this cautionary outlook. From March 24 to April 2, $5.6 million of $7.6 million in liquidations came from long positions. On March 28, SOL dropped from $137 to $125, triggering $3 million in liquidations. The excessive bullish leverage likely amplified volatility.
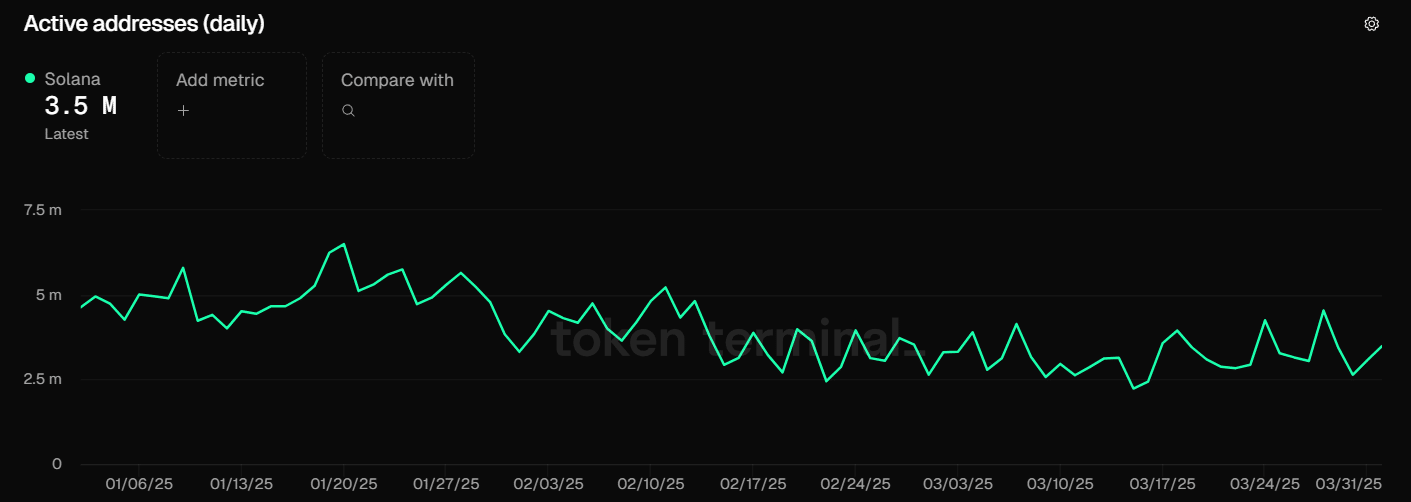
Meanwhile, Solana’s daily active addresses peaked at 6.5 million on January 20 but dropped 46% to 3.5 million by April 2. Activity has since stabilized above 2.5 million, indicating steady, but lower, engagement. January and March spikes were likely tied to events or launches, suggesting that Solana’s growth remains event-driven rather than sustained.
Analyzing token flows, redistribution from the $147-zone into lower price bands has eased overhead resistance while reinforcing support below $144. For now, SOL remains range-bound below $130, consolidating as traders await a decisive breakout catalyst.
Disclaimer: The information in this article is for general purposes only and does not constitute financial advice. The author’s views are personal and may not reflect the views of Chain Affairs. Before making any investment decisions, you should always conduct your own research. Chain Affairs is not responsible for any financial losses.
Also Read: Solana [SOL] Faces Critical Q2 After Losing $100B – Can It Avoid Further Declines?
I’m a crypto enthusiast with a background in finance. I’m fascinated by the potential of crypto to disrupt traditional financial systems. I’m always on the lookout for new and innovative projects in the space. I believe that crypto has the potential to create a more equitable and inclusive financial system.