|
Getting your Trinity Audio player ready...
|
Polkadot (DOT) continues to struggle under bearish pressure, with its price action showing a clear downward trend. Like many altcoins, DOT has erased almost all the gains it accumulated since November, leaving holders in a tough spot. However, recent indicators suggest a potential shift in momentum, giving traders reason for cautious optimism.
Key Levels to Watch
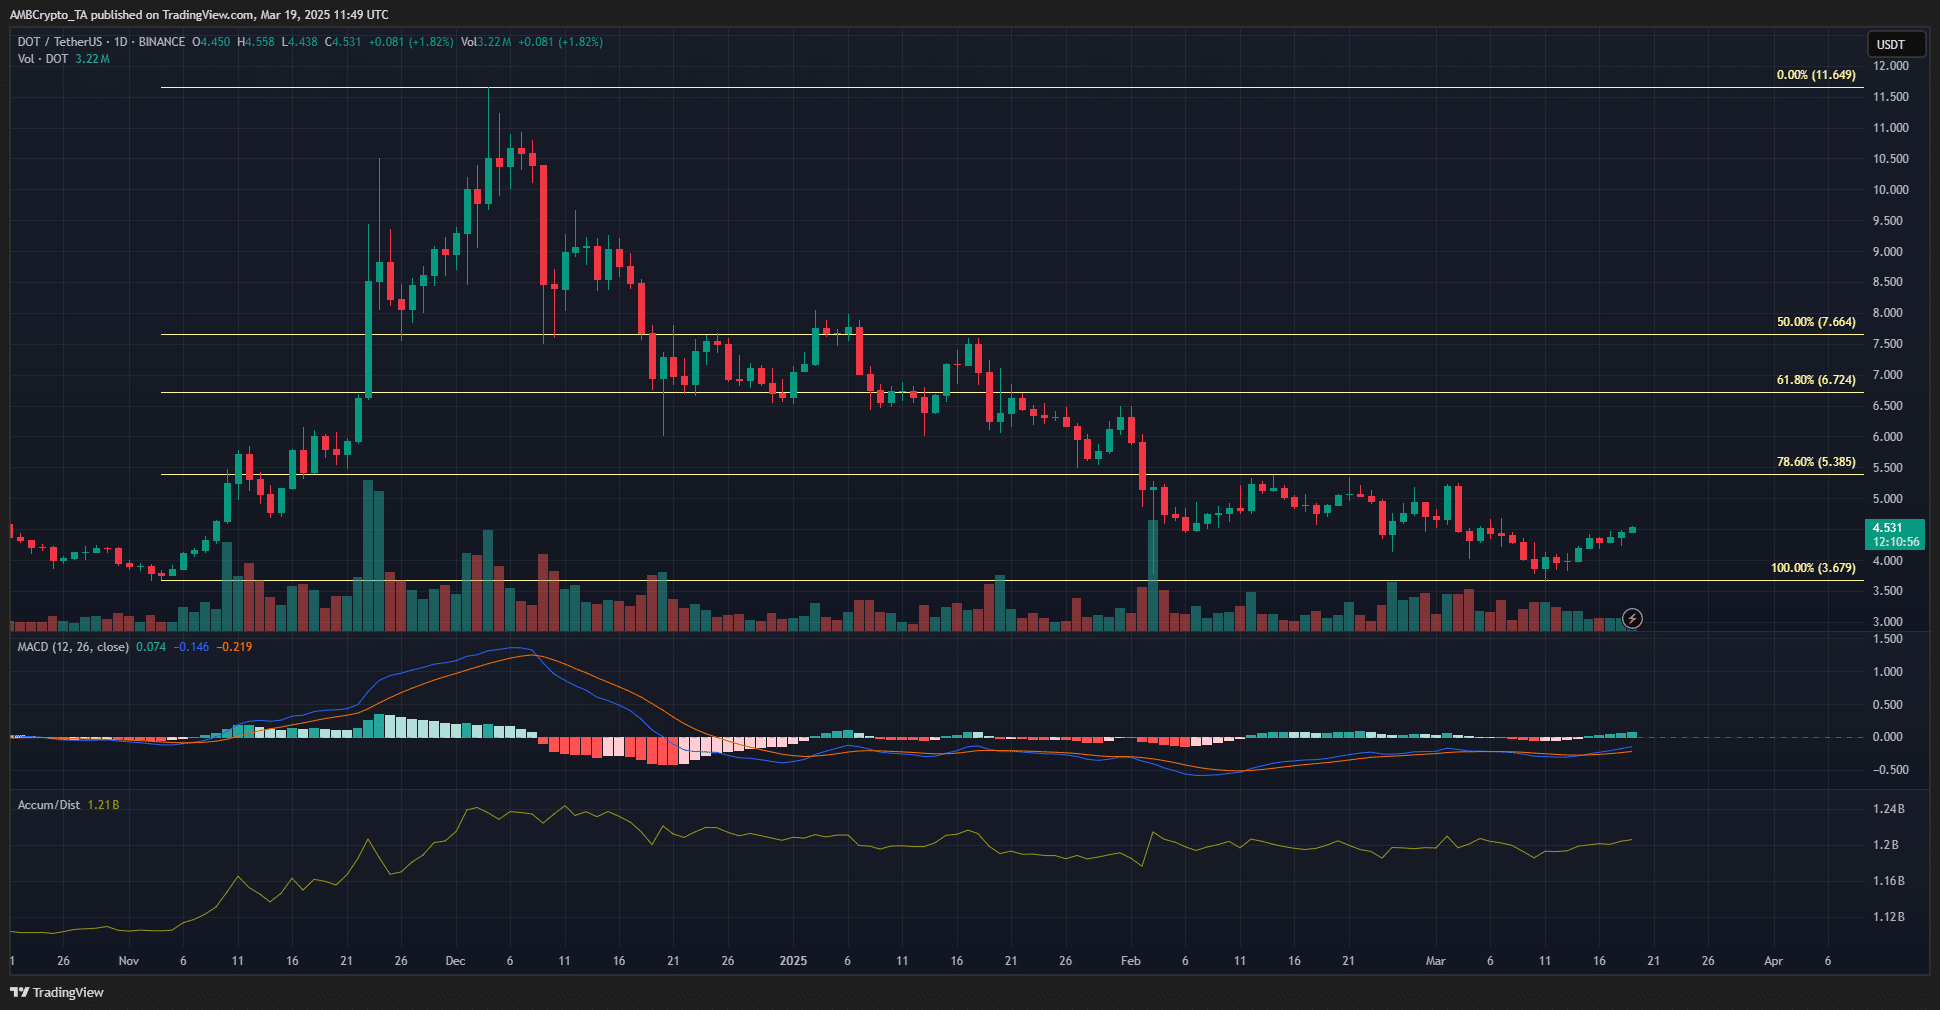
The DOT market structure remains bearish on the daily chart, with the crucial resistance level at $5.25. To break this bearish structure, DOT must decisively move beyond this level. However, before that, buyers must overcome local resistance at $4.50.
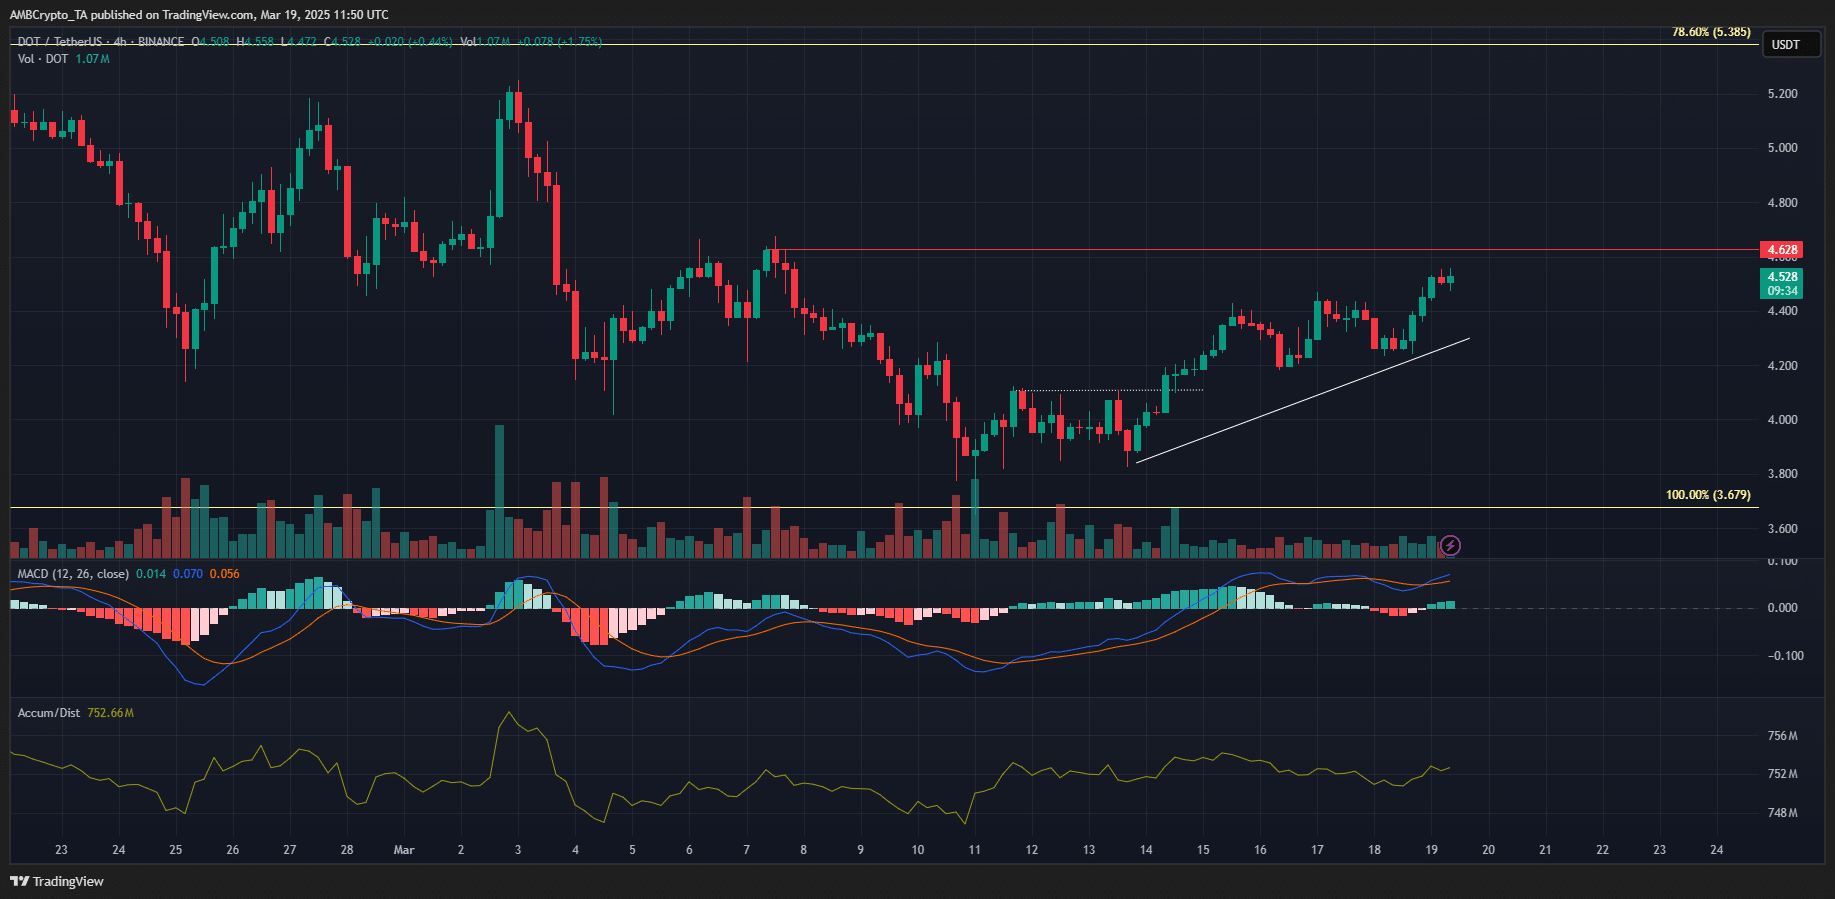
A key level for short-term traders is $4.62. A successful breach of this price point on the 4-hour chart could signal a bullish shift in the lower timeframe structure. If DOT manages to climb past this threshold, a 13% rally toward $5.25 could be possible.
Market Indicators: A Mixed Signal
The Moving Average Convergence Divergence (MACD) recently formed a bullish crossover. However, since it remains below the zero line, the broader momentum still leans bearish. Meanwhile, the Accumulation/Distribution (A/D) indicator has been making higher lows since February, signaling that despite the retracement, some accumulation is taking place. This suggests that the selling pressure may not be as strong as before.
Volume Trends: A Glimmer of Hope?
Unlike DOT’s price action, the A/D indicator’s gradual uptrend hints that the recent downtrend occurred with lower volume than the prior rally. This could mean that bullish momentum might return if key resistances are broken. However, many investors who bought during the rally are still in loss-making positions, potentially leading to increased selling pressure at breakeven levels.
Also Read: Polkadot (DOT) Breaks Out: Is a Bullish Reversal Toward $6.45 in Play?
While DOT faces stiff resistance ahead, a break past $4.62 could give bulls a fighting chance. The overall market structure remains bearish, but short-term traders might find profitable opportunities if the token continues its climb toward $5.25. However, overcoming major resistances at $5.38 and $6.72 remains a challenging task. Traders should watch volume trends closely and assess whether buying pressure can sustain any potential recovery.
Disclaimer: The information in this article is for general purposes only and does not constitute financial advice. The author’s views are personal and may not reflect the views of Chain Affairs. Before making any investment decisions, you should always conduct your own research. Chain Affairs is not responsible for any financial losses.
I’m a crypto enthusiast with a background in finance. I’m fascinated by the potential of crypto to disrupt traditional financial systems. I’m always on the lookout for new and innovative projects in the space. I believe that crypto has the potential to create a more equitable and inclusive financial system.