
|
Getting your Trinity Audio player ready...
|
Ethereum (ETH) has seen a 10% rebound from Tuesday’s lows, but the recovery appears fragile as market indicators suggest further downside risk. The bounce occurred ahead of the U.S. Federal Reserve meeting, which held no surprises—economic growth projections for 2025 remain slow, and the Fed signaled two potential rate cuts this year. While not outright bearish for crypto, these developments have led to mixed market reactions.
Bitcoin (BTC) briefly surged to $87,500 before experiencing a slight retracement, and Ethereum mirrored this movement, dipping 2.36% from its recent high of $2,069. A concerning factor for investors is Ethereum’s declining network activity, which has reached its lowest point in 2025, hinting at waning market participation.
Ethereum’s Technical Indicators Flash Warning Signs
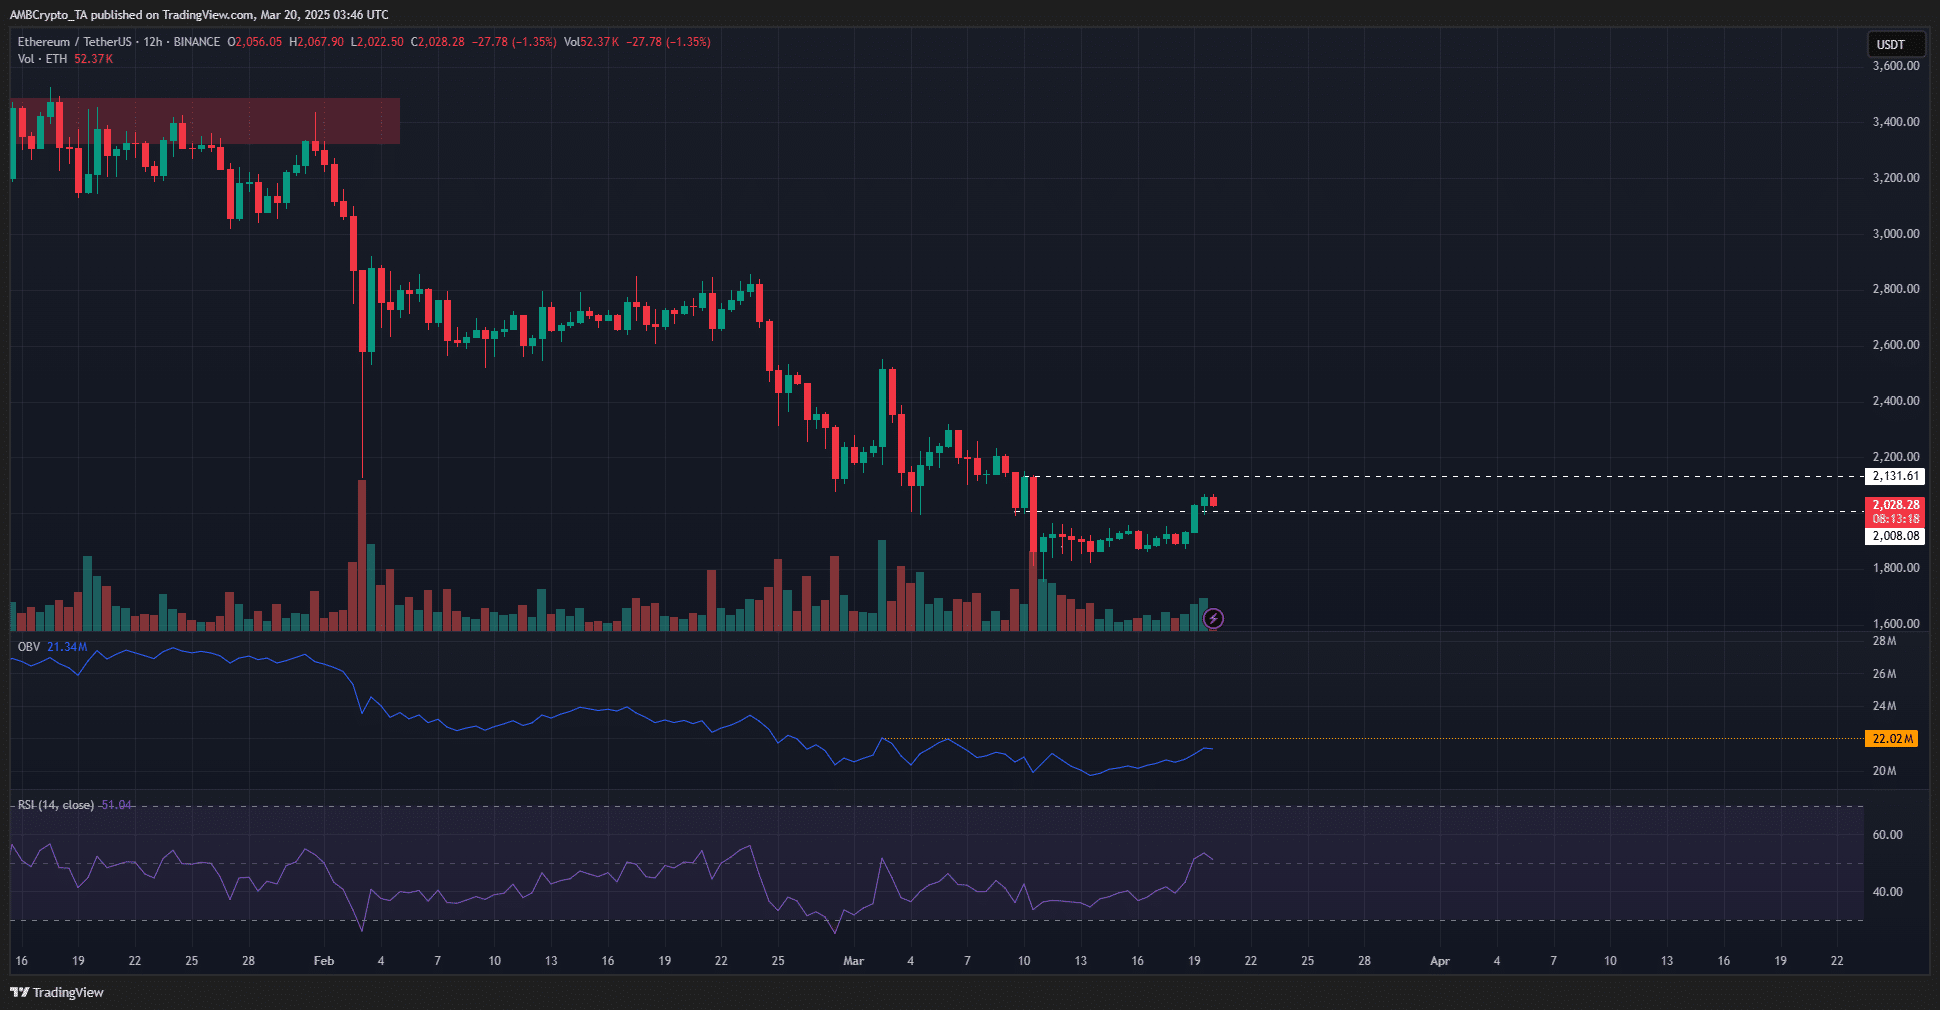
On Ethereum’s 1-day chart, the asset remains in a bearish trajectory. The On-Balance Volume (OBV) is failing to reclaim local highs, suggesting weak buying pressure. Meanwhile, the Relative Strength Index (RSI) is signaling a potential bullish shift, but traders remain cautious about a liquidity hunt rather than a genuine recovery.
For a sustained reversal, ETH needs significant buying volume, which is currently lacking. Market sentiment remains broadly fearful, with key indicators suggesting a possible move lower in the coming days.
Ethereum Exchange Netflows Indicate Selling Pressure
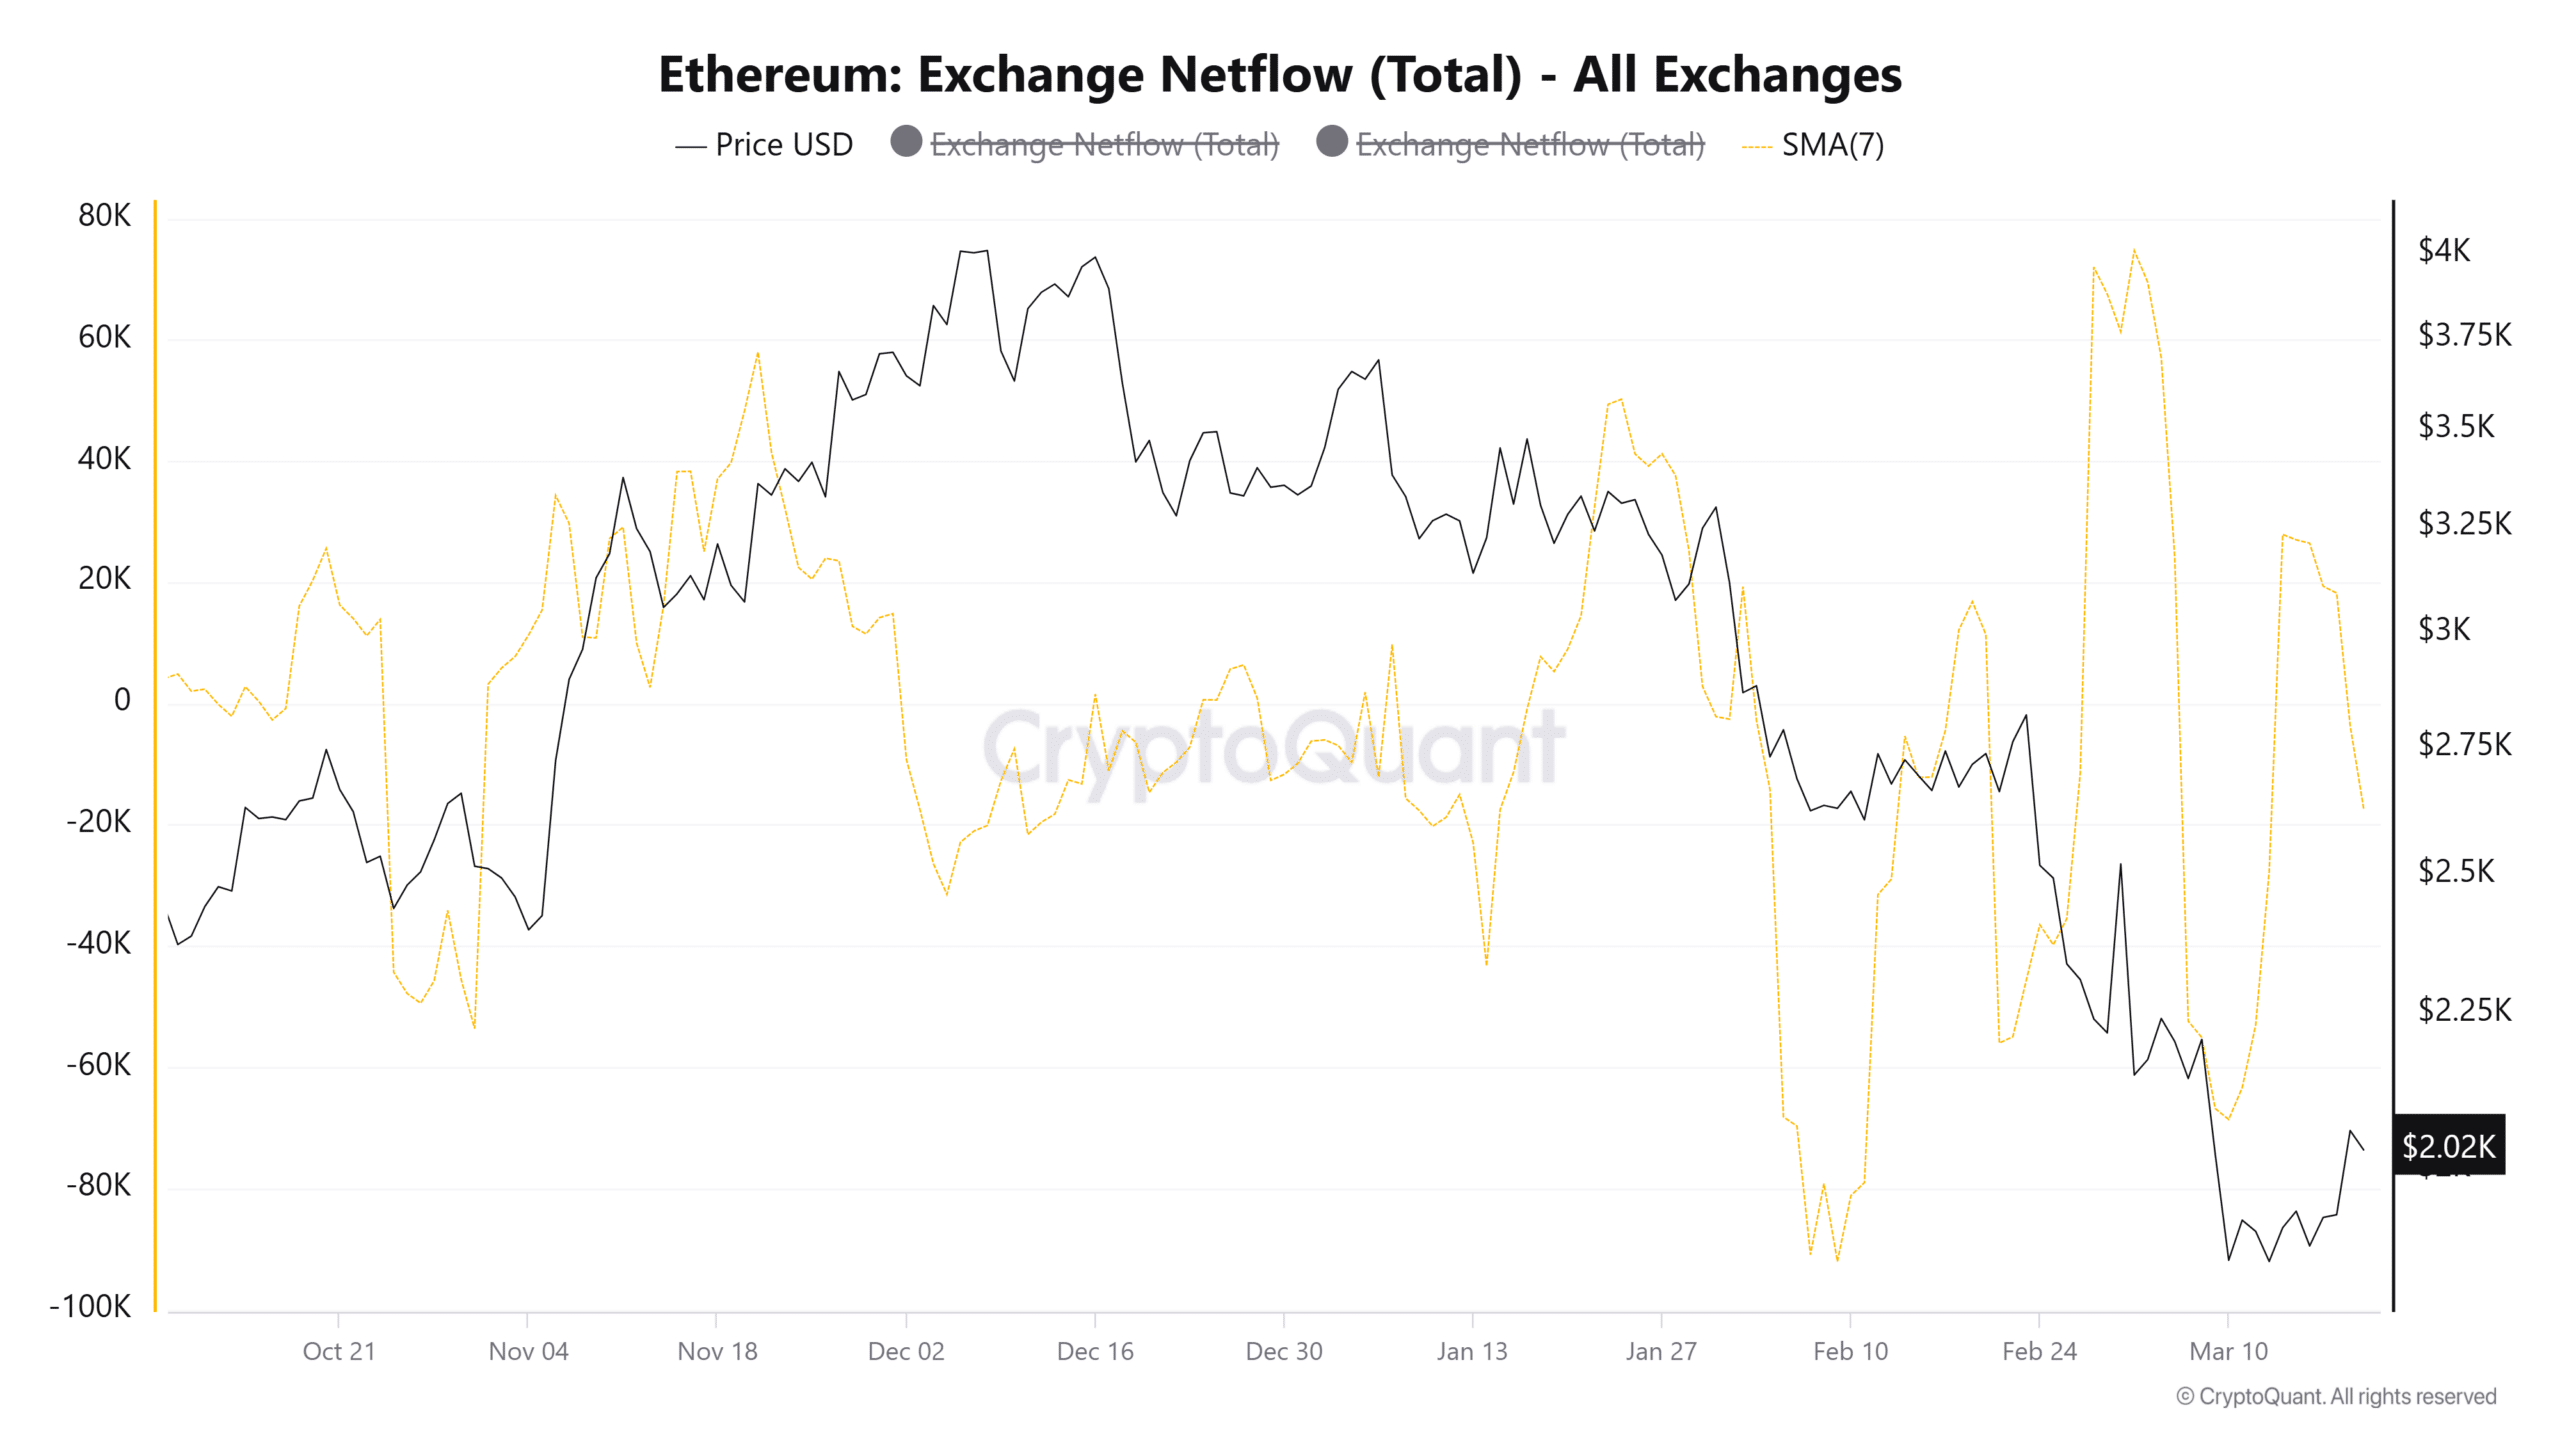
Exchange netflows, which track the movement of ETH in and out of exchanges, reveal concerning trends. Higher inflows indicate selling pressure, while increased outflows suggest accumulation.
Since mid-January, four significant spikes in ETH inflows have been recorded—on January 24, February 19, March 3, and March 14. Each of these was followed by sharp price drops, with the March spike coinciding with Ethereum’s decline from $2,800 to $1,800. If this pattern persists, another price drop could be imminent.
Taker Ratio Confirms Bearish Sentiment
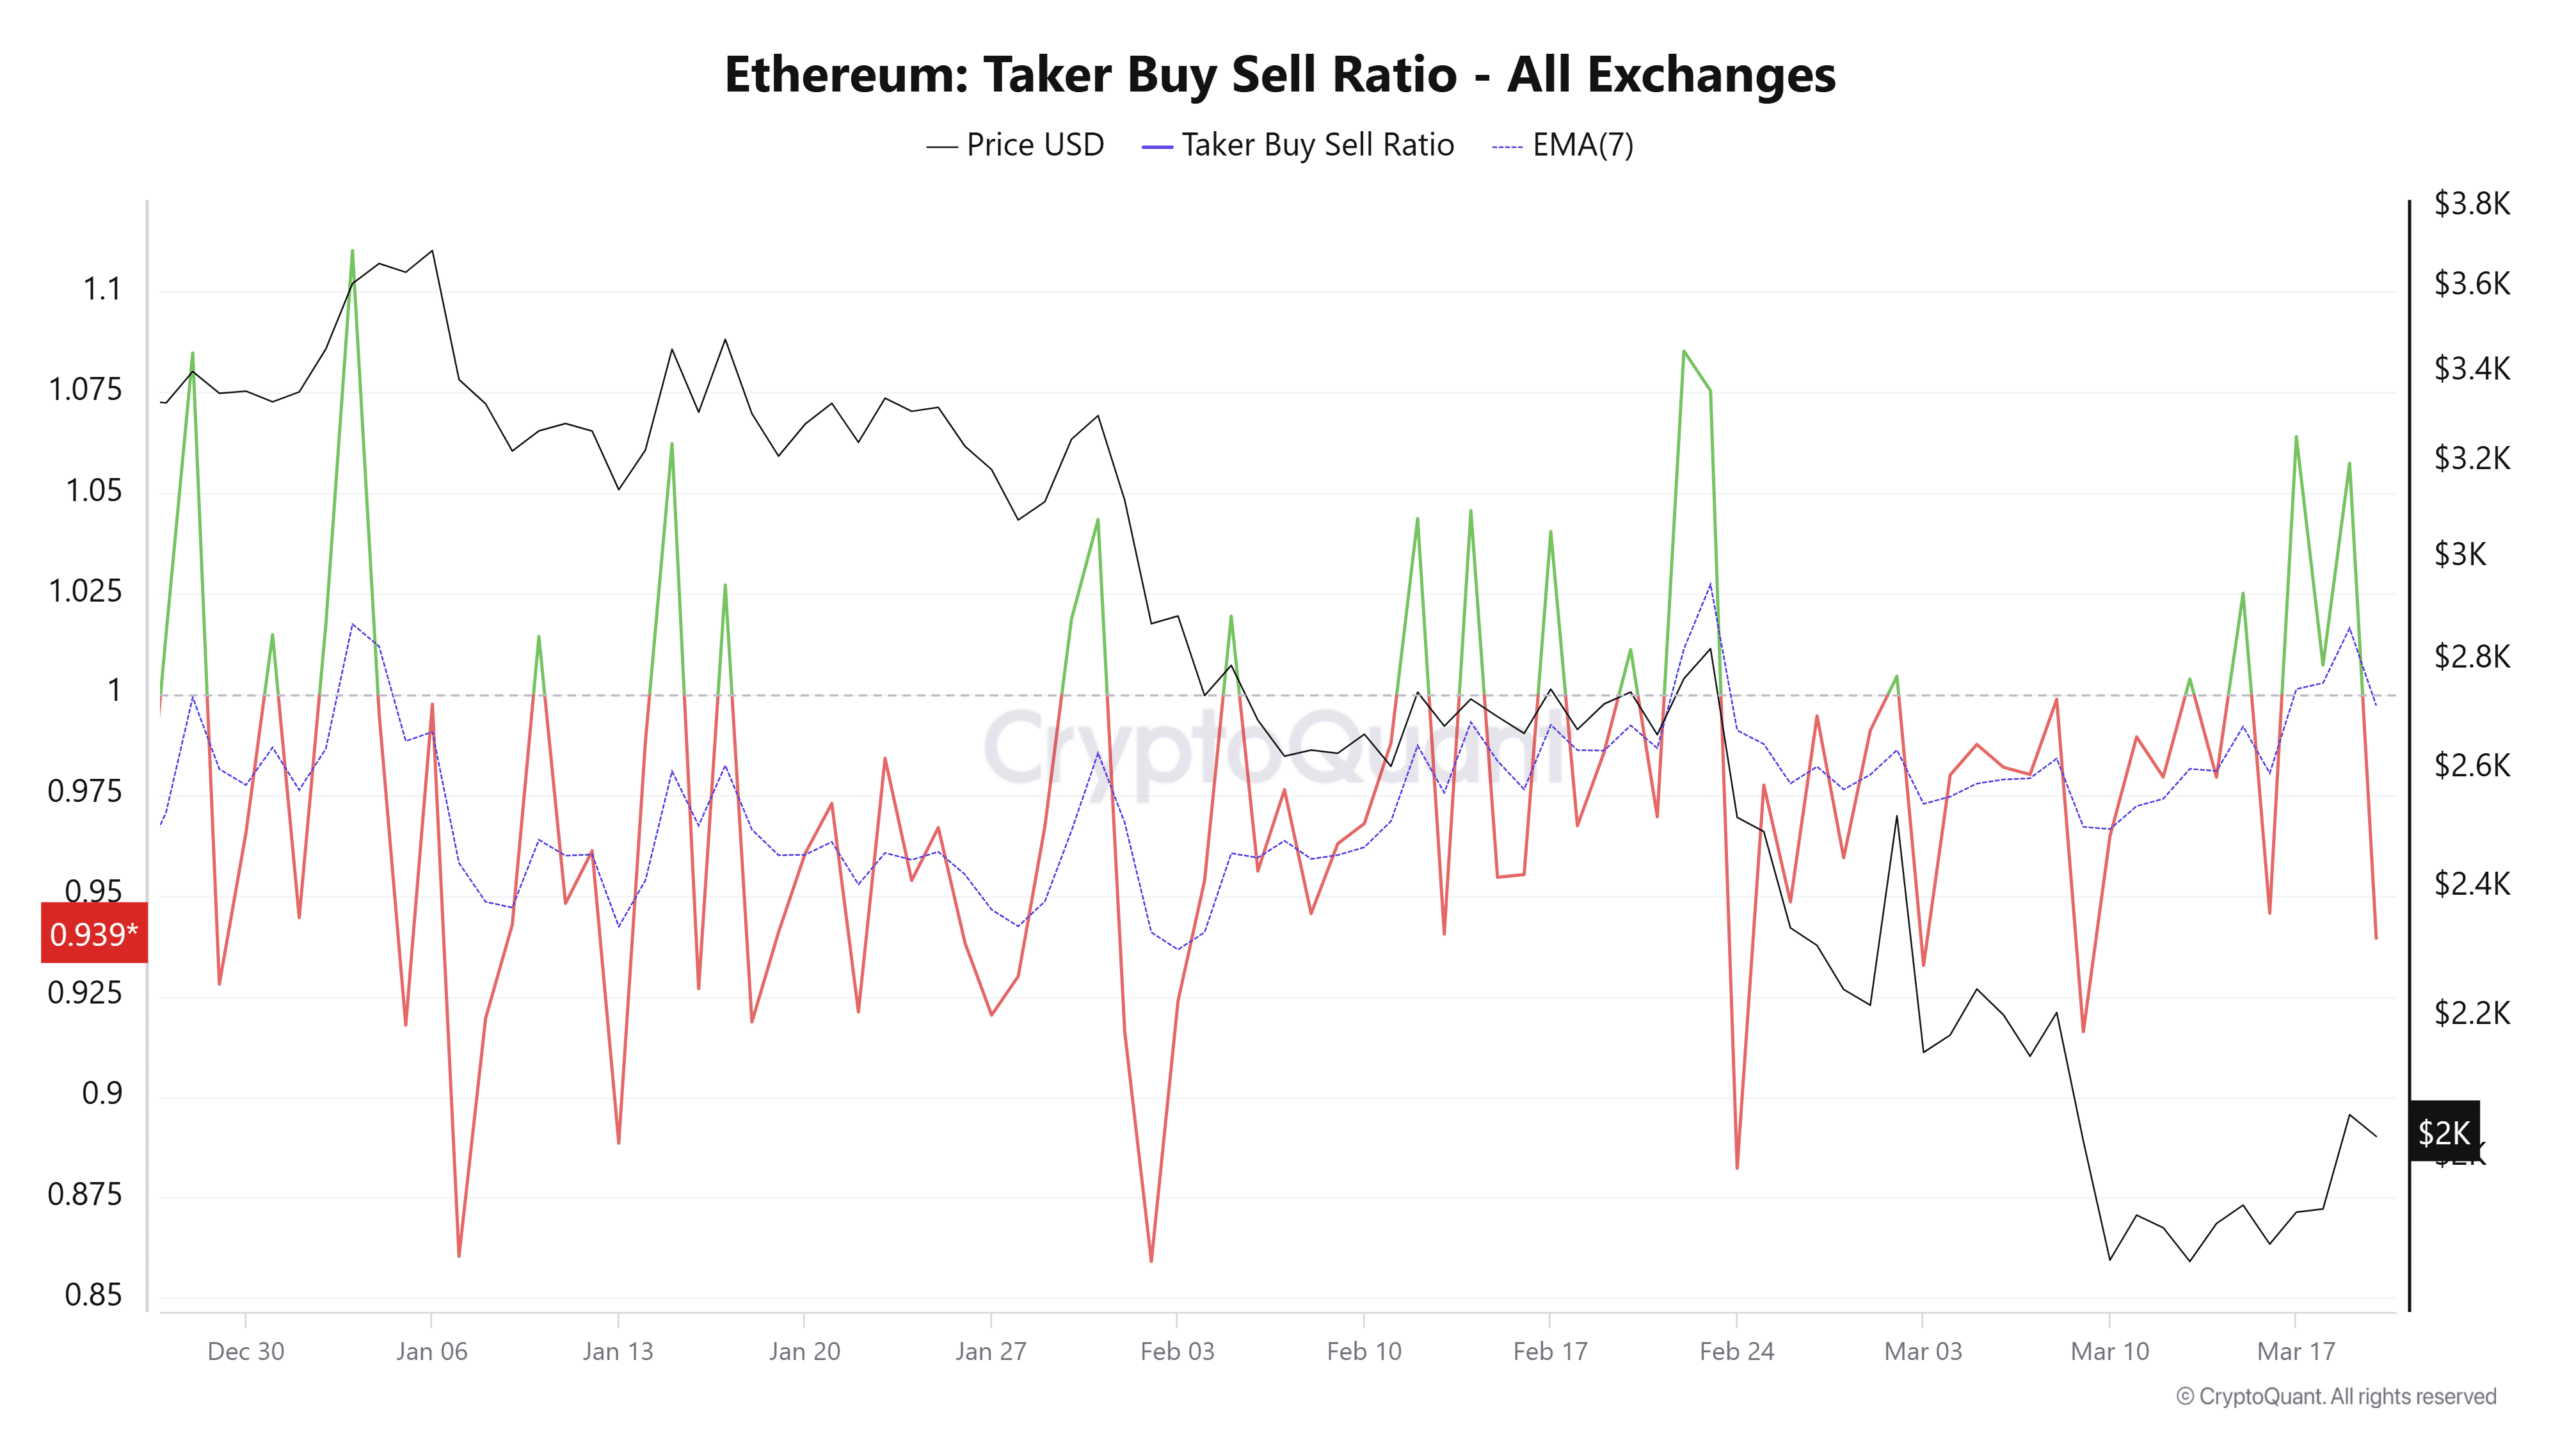
The taker buy/sell ratio, which measures market order volume, shows that bearish sentiment has dominated over the past three weeks. While there was a brief shift toward bullishness, it proved short-lived, and the 7-day EMA of the taker ratio has turned negative again.
Also Read: Ethereum Eyes $2K Recovery: Breakout or More Losses?
With exchange netflows and price action aligning, Ethereum could face another downturn, potentially dropping to $1,750 or lower in the coming days.
Disclaimer: The information in this article is for general purposes only and does not constitute financial advice. The author’s views are personal and may not reflect the views of Chain Affairs. Before making any investment decisions, you should always conduct your own research. Chain Affairs is not responsible for any financial losses.
I’m your translator between the financial Old World and the new frontier of crypto. After a career demystifying economics and markets, I enjoy elucidating crypto – from investment risks to earth-shaking potential. Let’s explore!