|
Getting your Trinity Audio player ready...
|
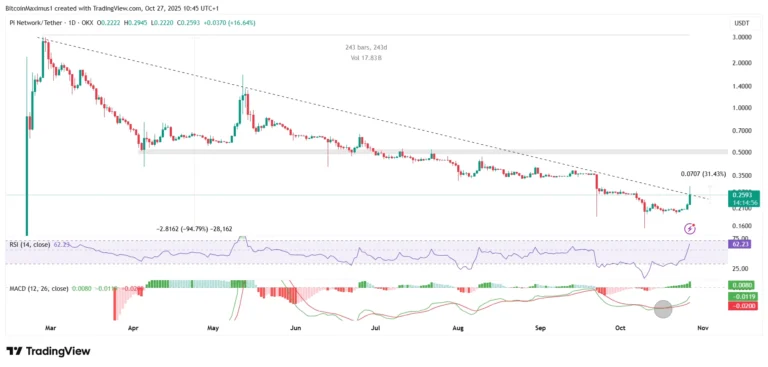
- PI price surged over 30% but must close above diagonal resistance to confirm a trend reversal.
- Pi Network reached 2.69M users and completed KYB verification, boosting adoption and credibility.
- Short-term technical signals suggest resistance at $0.29 may limit further gains for now.
After months of decline, Pi Network (PI) is showing renewed activity, sparking hope among investors that a long-awaited breakout could be on the horizon. Recent milestones and technical indicators are fueling optimism, though caution remains for traders eyeing short-term gains.
Pi Network Price Analysis: Breaking the Downtrend?
Since its launch, Pi Network’s price has struggled, hitting an all-time low of $0.153 on October 10—a staggering 95% drop from its peak. The coin has been contained within a descending resistance trend line for 243 days.
Today’s rally, with PI surging over 30%, marks one of the most significant bullish moves since the downward trend began. Price action shows the coin attempting to break out from this long-term diagonal resistance. A confirmed close above this line could propel PI toward its next resistance at $0.50, signaling a potential end to the bearish trend.
Technical indicators add further support. The Relative Strength Index (RSI) has climbed above 50, while the Moving Average Convergence/Divergence (MACD) recently made a bullish cross. Despite this, traders are reminded that previous RSI spikes above 50 have failed to sustain upward momentum, meaning the breakout is not yet guaranteed.
Why Pi Coin is Gaining Attention
Fundamental developments have played a key role in PI’s resurgence. Pi Network has now reached 2.69 million mainnet users, demonstrating strong adoption. Additionally, OKX announced that Pi completed its Know Your Business (KYB) verification, boosting credibility and investor confidence.
@PiCoreTeam @nkokkalis @Chengdiao
— Pi Coin Magazine (@Pi_CoinMagazine) October 27, 2025
The Unparalleled Value of Pi Coin in the Cryptocurrency Space
As we move forward, the truth about Pi Network will become increasingly clear, illuminating the stark differences between misinformation and reality, as well as between darkness and… pic.twitter.com/iC5r693Pck
However, short-term charts suggest potential challenges ahead. Wave count analysis indicates a completed A-B-C correction, and the $0.29 horizontal resistance proved difficult to breach, hinting at a possible local top. This means while the weekly trend looks positive, the short-term outlook remains uncertain.
Also Read: Pi Network Hits 3.36M KYC Verifications — But Can It Recover From a 90% Price Crash?
What’s Next for Pi Network?
The road ahead for Pi Network hinges on whether it can break and close above the diagonal resistance. A sustained breakout could mark a true trend reversal, attracting more investors and fueling further gains. Until then, today’s surge may be a temporary spike, with PI’s price vulnerable to another pullback.
Pi Network is at a pivotal moment. Milestones and bullish indicators bring optimism, but traders must watch key resistance levels to confirm whether PI’s downtrend is finally over.
Disclaimer: The information in this article is for general purposes only and does not constitute financial advice. The author’s views are personal and may not reflect the views of Chain Affairs. Before making any investment decisions, you should always conduct your own research. Chain Affairs is not responsible for any financial losses.
I’m a crypto enthusiast with a background in finance. I’m fascinated by the potential of crypto to disrupt traditional financial systems. I’m always on the lookout for new and innovative projects in the space. I believe that crypto has the potential to create a more equitable and inclusive financial system.