
|
Getting your Trinity Audio player ready...
|
Pepe (PEPE) has experienced notable outflows from exchanges in recent weeks, with some evidence of accumulation among investors. However, despite these positive signs, the broader trend remains bearish. Holders continue to sit at a loss as sustained selling pressure has dictated the overall market direction throughout 2024.
While the long-term outlook remains cautious, short-term traders may find opportunities for minor gains. PEPE has been consolidating within a defined range, and a potential move to the upper boundary appears likely. Here’s what traders should watch closely.
Pepe Rebounds from Mid-Range Support
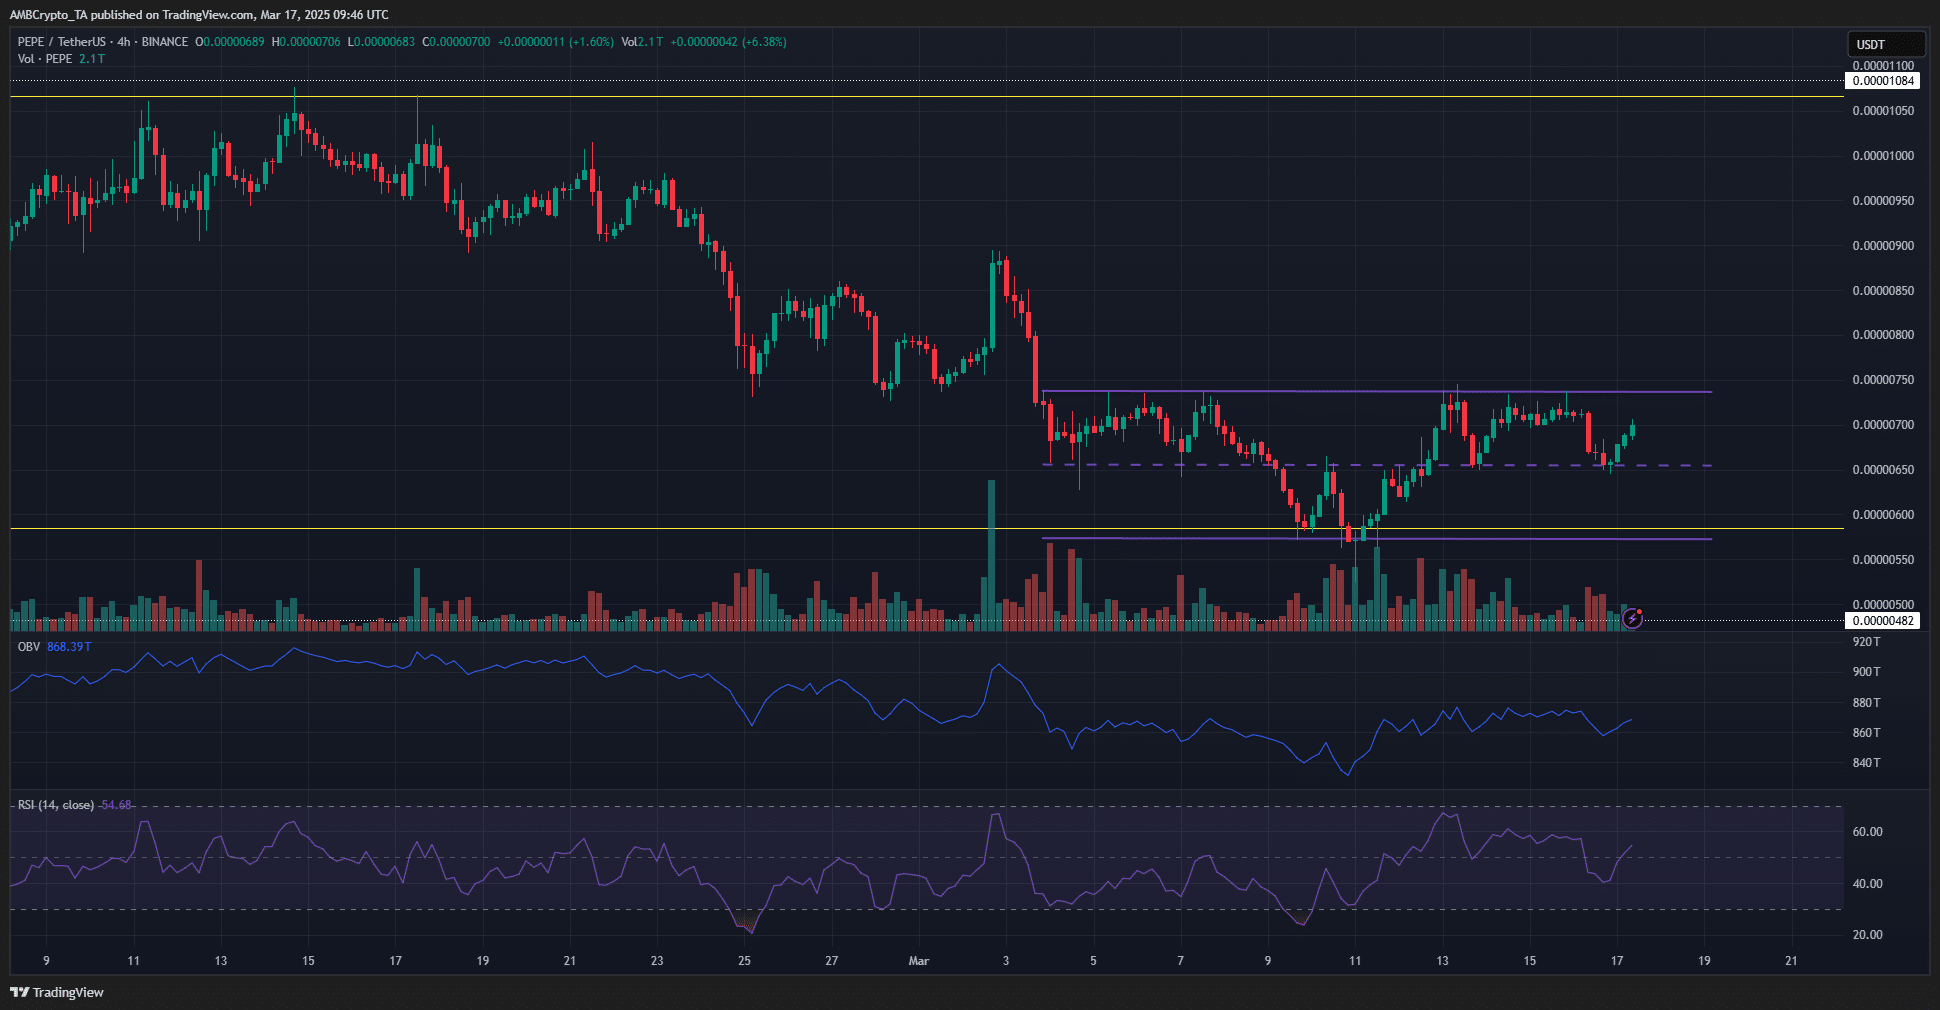
On the 4-hour chart, PEPE has been oscillating between $0.00000572 and $0.00000736 for the past two weeks. The mid-range level of $0.00000655 has been a key support area, repeatedly tested and defended by buyers. This strengthens the validity of the range formation and suggests that PEPE may be primed for another bounce toward the range highs.
Technical indicators support this outlook. The Relative Strength Index (RSI) has climbed back above neutral 50, indicating a resurgence of short-term bullish momentum. While a breakout beyond the range remains unlikely, traders should remain cautious and manage risk in case unexpected volatility emerges.

Key Liquidity Levels and Price Targets
A look at the 1-month liquidation heatmap from Coinglass reveals a cluster of liquidity at $0.0000075, slightly above the current range high. This suggests that PEPE could see a 5% price jump in the coming days, driven by the liquidity sweep. Further ahead, the $0.000009 level stands out as the next potential resistance zone where traders should take profits.
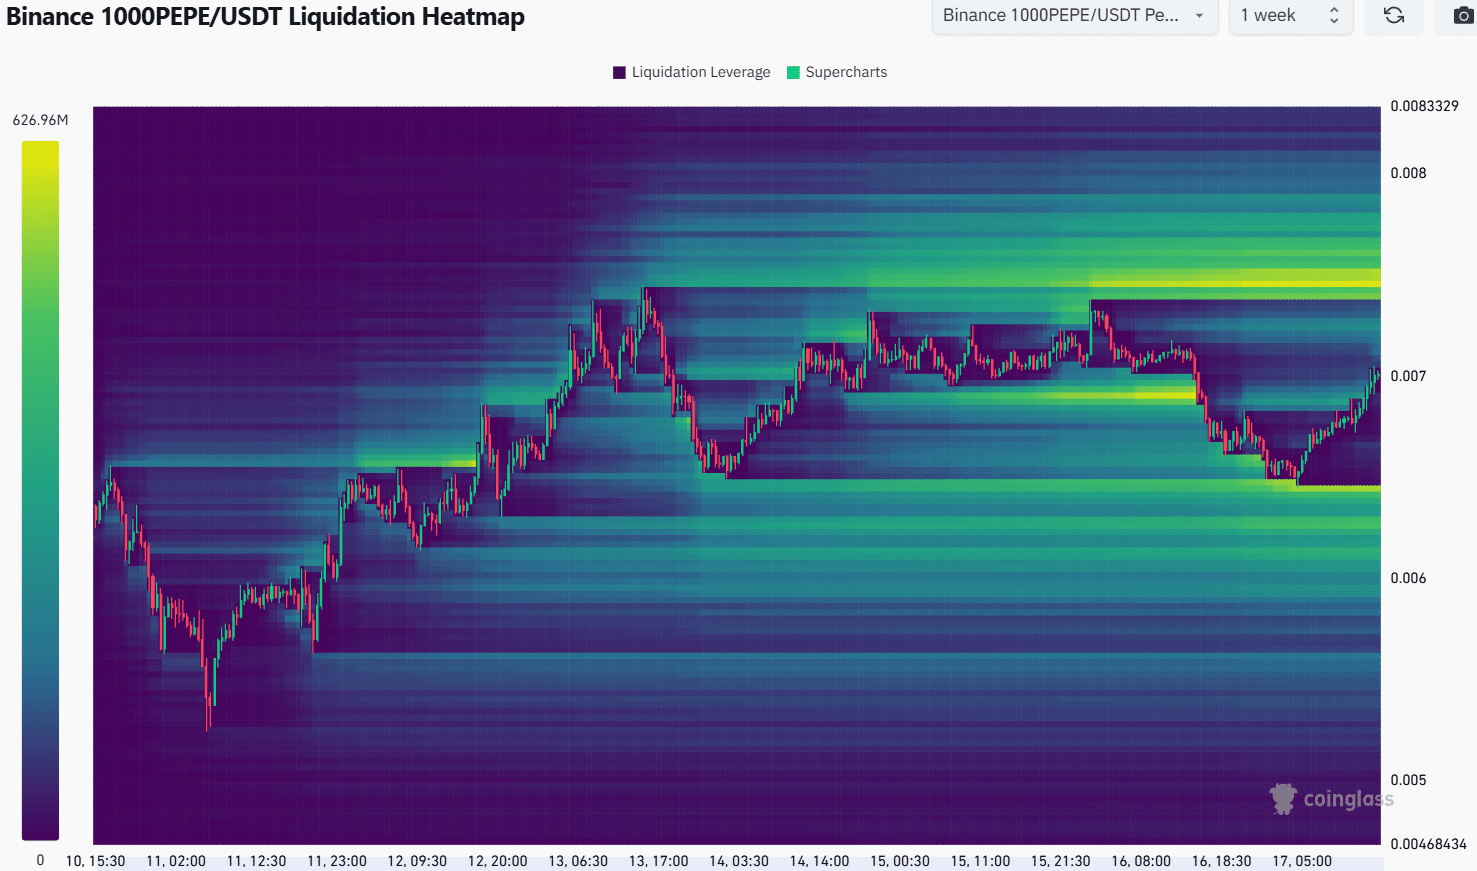
However, volume indicators do not support a breakout beyond the range, reinforcing the expectation that PEPE will remain within its current trading structure. The 1-week heatmap also highlights a liquidity pocket at $0.00000745-$0.0000075, aligning with the near-term bullish target.
External Market Factors
Bitcoin (BTC) volatility remains a key risk factor. If BTC experiences sudden price swings, it could disrupt PEPE’s range formation and lead to deviations above or below key levels. Traders should closely monitor market conditions, particularly during the New York session, when traditional markets influence broader crypto movements.
Also Read: Pepe Coin (PEPE) Skyrockets 7% as Whales Accumulate $4.3M – Is a Surge Incoming?
For now, PEPE’s range-bound trading pattern presents opportunities for swing traders, but caution remains warranted amid the ongoing bearish pressure.
Disclaimer: The information in this article is for general purposes only and does not constitute financial advice. The author’s views are personal and may not reflect the views of Chain Affairs. Before making any investment decisions, you should always conduct your own research. Chain Affairs is not responsible for any financial losses.
I’m your translator between the financial Old World and the new frontier of crypto. After a career demystifying economics and markets, I enjoy elucidating crypto – from investment risks to earth-shaking potential. Let’s explore!