
|
Getting your Trinity Audio player ready...
|
Chainlink (LINK) has shown little movement over the past 24 hours, maintaining a market cap of $10.3 billion. Meanwhile, Pi Network stands at approximately $12.7 billion. As several technical indicators reach critical levels, the coming days will be pivotal in determining whether LINK continues its rally or faces a correction.
DMI Signals Bearish Shift for LINK
Chainlink’s Directional Movement Index (DMI) suggests that sellers have taken control. The Average Directional Index (ADX), a measure of trend strength, has declined from 26 to 20.46, indicating a weakening trend. Typically, an ADX above 25 signals a strong trend, while a drop toward 20 suggests a loss of momentum.
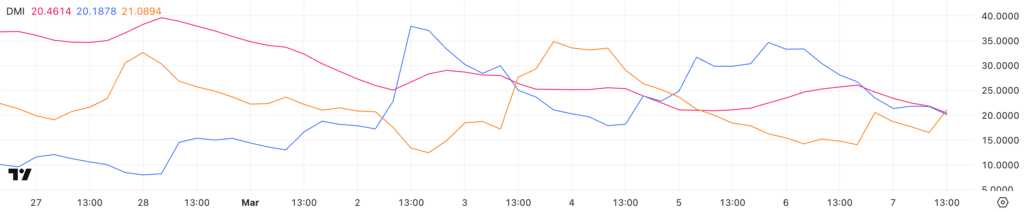
Additionally, the Positive Directional Indicator (+DI) has dropped sharply from 33.3 to 20.1, while the Negative Directional Indicator (-DI) has risen from 14.2 to 21. This crossover suggests a potential shift from bullish to bearish momentum. If ADX falls below 20, LINK could enter a consolidation phase rather than continue its upward trajectory.
BBTrend Turns Positive, Hinting at Bullish Momentum
Despite the bearish signals from the DMI, LINK’s Bollinger Bands Trend (BBTrend) has turned positive, reaching 3.69 after staying in negative territory since March 4. Previously, the indicator recorded a low of -20 on February 28.
BBTrend measures price movements relative to Bollinger Bands, and a positive reading indicates growing bullish momentum. While the shift to positive territory is a promising sign, the modest value suggests that bullish momentum is still developing rather than firmly established.

Can LINK Reclaim $20 in March?
LINK’s Exponential Moving Averages (EMAs) are currently trending downward, raising concerns about a potential death cross. A break below the $15.79 support level could lead to further declines, with possible tests of $14 and $13.45.
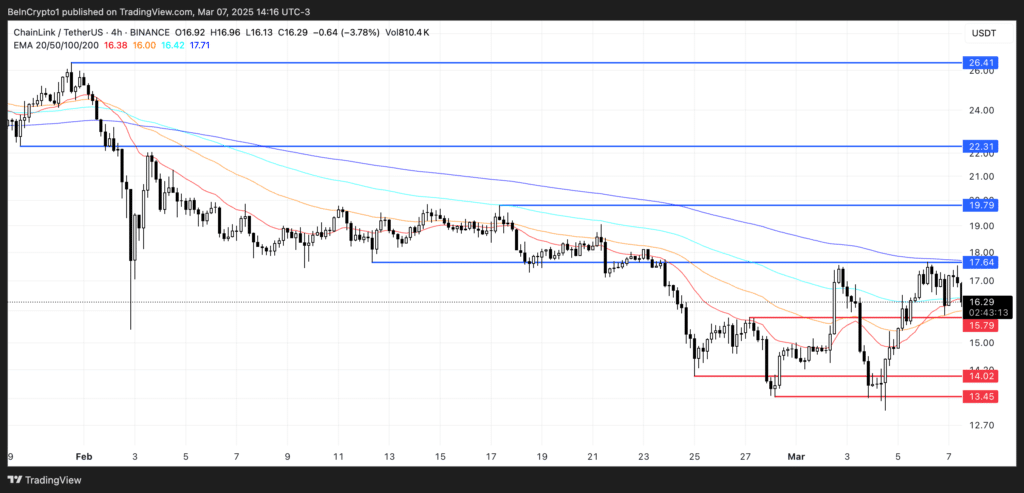
Conversely, if LINK gains traction and surpasses the $17.64 resistance level, it could target $19.79 and even $22.31. A stronger rally might push LINK past $25, a level not seen in over a month.
Also Read: Is Chainlink’s Market Shake-Up Fueling LINK’s Rebound? Key Levels to Watch
With conflicting indicators, the next decisive move in LINK’s price will depend on whether it breaks below $15.79 or surges past $17.64, setting the tone for its short-term trajectory.
Disclaimer: The information in this article is for general purposes only and does not constitute financial advice. The author’s views are personal and may not reflect the views of Chain Affairs. Before making any investment decisions, you should always conduct your own research. Chain Affairs is not responsible for any financial losses.

I’m a crypto enthusiast with a background in finance. I’m fascinated by the potential of crypto to disrupt traditional financial systems. I’m always on the lookout for new and innovative projects in the space. I believe that crypto has the potential to create a more equitable and inclusive financial system.