
|
Getting your Trinity Audio player ready...
|
- BNB trades within an ascending triangle, signaling a potential breakout.
- Whale accumulation strengthens bullish sentiment.
- Technical indicators suggest a move toward $1,092 before year-end.
BNB reached a record high of $868.68 on August 14 but has since eased to $851.97. Despite this modest pullback, analysts see the move as a short-term breather rather than a trend reversal. The cryptocurrency continues to trade within an ascending triangle pattern—a bullish setup that often precedes breakouts once resistance is cleared.
Further supporting optimism, BNB has moved above the Ichimoku Cloud on the 4-hour chart, signaling strong support levels below the price and a favorable momentum shift. Traders watching these indicators suggest that the next leg higher could be imminent.
Technical Indicators Point to Bullish Momentum
The Awesome Oscillator (AO) has recently shown green histogram bars in positive territory, reinforcing short-term momentum gains. A sustained green reading often reflects rising buying interest, indicating BNB could soon challenge the $862.20 resistance again.
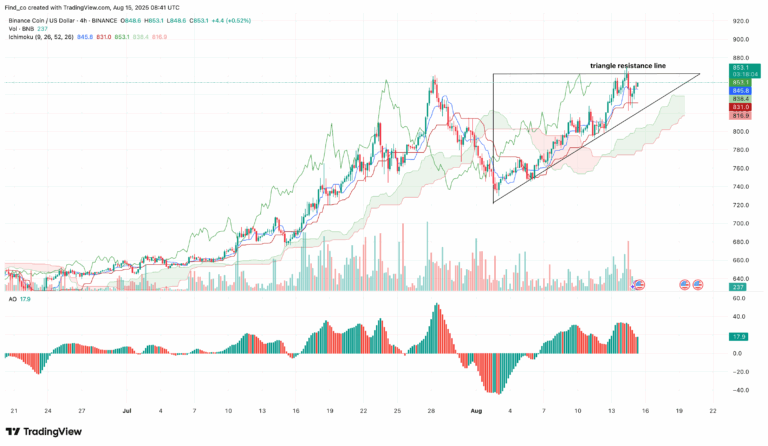
Maintaining its position above the cloud and pressing toward the triangle’s resistance line could trigger another rally, positioning BNB for potential multi-week gains.
Whales Fuel Confidence and Price Strength
On-chain data reveals that wallets holding over 10,000 BNB coins have surged, highlighting significant accumulation by large holders. Whales typically influence price movements heavily, and their increased participation often signals confidence in the asset’s long-term potential.
This accumulation, paired with bullish technical setups, strengthens the probability of a continued short-term upswing in BNB.
Targets Point Toward Four-Figure Levels
Daily chart analysis shows that the Money Flow Index (MFI) has broken above its previous downtrend and remains above the neutral 50 mark, suggesting persistent buying pressure. Should this trend continue, BNB could surpass the $869.70 resistance level, with the next major target at $1,092.90—potentially a new all-time high.
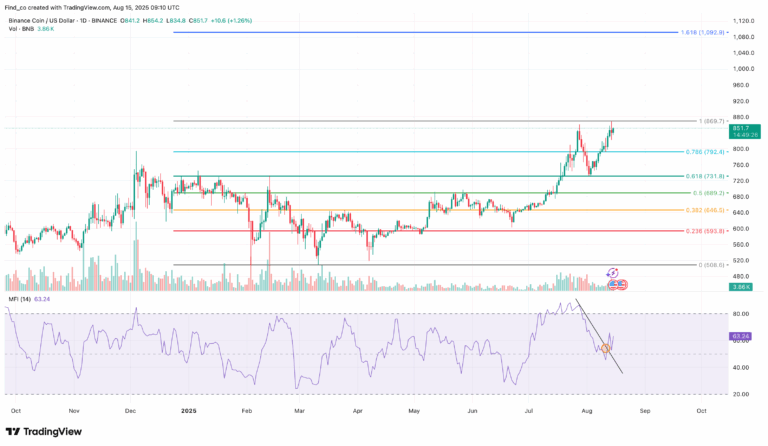
However, traders should also consider risk scenarios. Increased selling pressure could push BNB back to $792.40, corresponding to the 0.786 Fibonacci retracement level.
BNB’s brief pullback is unlikely to dampen bullish momentum. Strong technical setups, whale accumulation, and positive capital flow indicators position the cryptocurrency for a potential breakout toward four-figure territory before year-end.
Disclaimer: The information in this article is for general purposes only and does not constitute financial advice. The author’s views are personal and may not reflect the views of Chain Affairs. Before making any investment decisions, you should always conduct your own research. Chain Affairs is not responsible for any financial losses
Also Read: Binance Coin (BNB) Breaks $850 — Analysts Predict 134% Surge to $2,000 in 2025
I’m a crypto enthusiast with a background in finance. I’m fascinated by the potential of crypto to disrupt traditional financial systems. I’m always on the lookout for new and innovative projects in the space. I believe that crypto has the potential to create a more equitable and inclusive financial system.