


|
Getting your Trinity Audio player ready...
|
Key Takeaways
- BTC dipped to $83,560 and wiped out roughly $550M in longs, but held its 21-day moving average near $83,850.
- Four wallets opened 40x BTC shorts on Hyperliquid just before the drop, while open interest rebounded from $54.2B to $55.3B.
- Rekt Capital says bulls need a daily close above $86,700 for confirmation; $82,500 is the deeper support.
Bitcoin took a sudden hit on Wednesday, dropping under $84,000 and wiping out more than $500 million in leveraged long positions. The price held a key support line, and traders appear to be returning quickly.
The Flash Drop
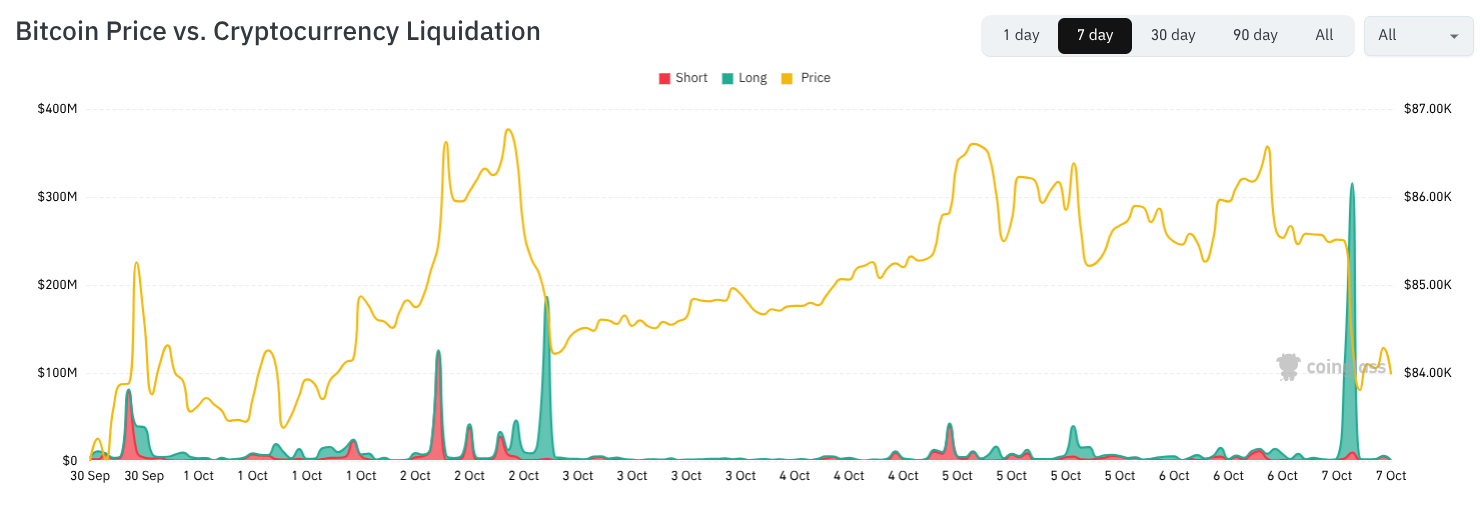
BTC fell as much as 2.3% across two hourly candles, touching $83,560 before recovering to hover around $84,000 at the time of writing, according to TradingView data. It was still trading about 1.8% lower on the day.
The dip followed a stalled rally. Thick sell orders on exchange order books capped the price below $86,500 on Tuesday. CoinGlass data shows cumulative 24-hour long liquidations reached $550 million as the move played out.

Hyperliquid Shorts Draw Attention
Just before the overnight drop, four wallets used USDC to open shorts on 148.49 BTC at 40x leverage on Hyperliquid, based on onchain data from Lookonchain and others. Analysts flagged the timing, and the move fed suspicion that the positions may have been tied to the sell-off. The data shows the sequence of events, not proof of cause, and it doesn’t establish what the wallets’ owners intended.
Open Interest Rebounds
Once the long positions were flushed, open interest started climbing again. Across the 21 exchanges CoinGlass tracks, OI rose from about $54.2 billion to $55.3 billion over six hours, between 4 a.m. and 10 a.m. UTC. That may suggest traders were comfortable adding BTC exposure near the local lows, though rising OI alone doesn’t show whether new positions are long or short.
Also Read: Bitcoin Hits a $85K Sell Wall as ETF Inflows Fade, Here is What On-Chain Data Says
Support Levels in Focus
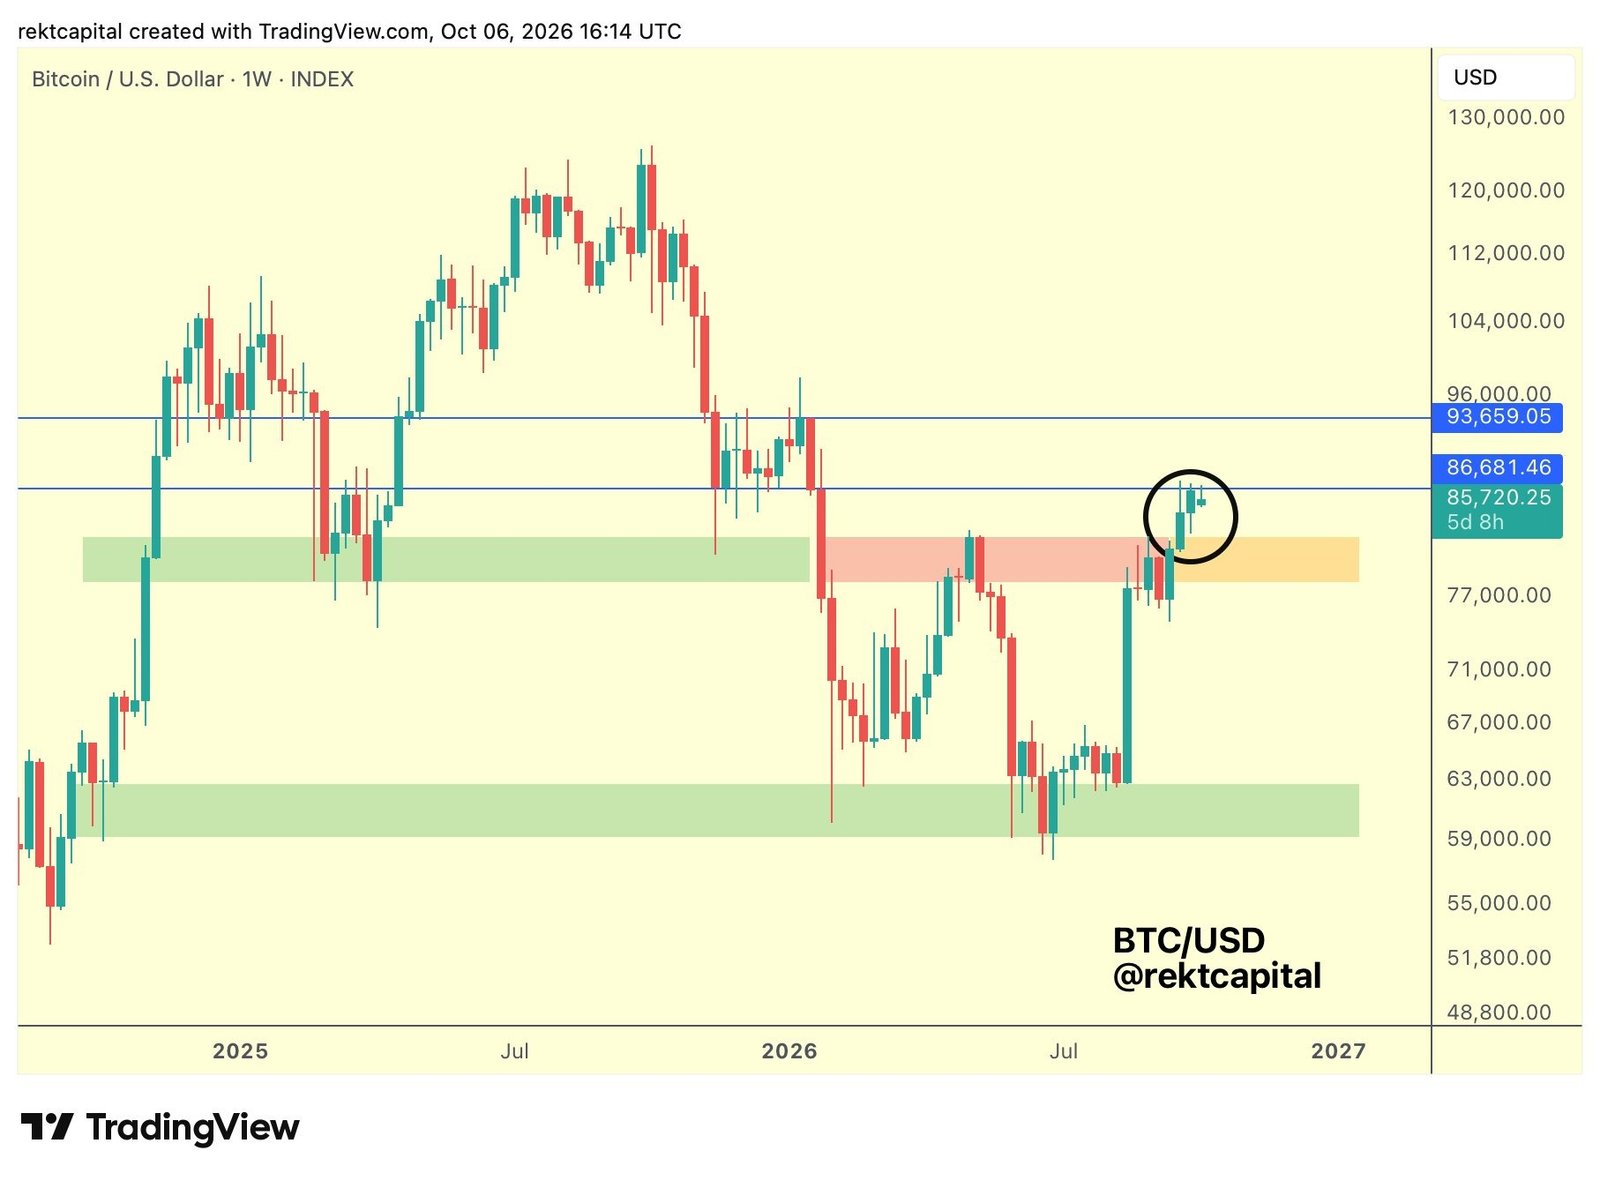
Bitcoin held its 21-day simple moving average, near $83,850, which Cointelegraph has previously described as a line in the sand for bulls on lower timeframes. If that level fails, $82,500 is the next area to watch. It forms part of an inverse head-and-shoulders reversal pattern still developing on the weekly chart, and price last tested it on Sept. 28.
On the upside, analyst Rekt Capital said a daily close above $86,700 is needed to keep the bullish setup intact. “At the moment, Bitcoin is lacking that lower timeframe confirmation relative to this key level for continuation,” he told followers on X on Tuesday.

What to Watch
Three levels now frame the market: $83,850 as immediate support, $82,500 as the deeper floor, and $86,700 as the confirmation line for bulls. Until BTC closes above the latter, the setup stays unconfirmed.
Disclaimer: The information in this article is for general purposes only and does not constitute financial advice. The author’s views are personal and may not reflect the views of Chain Affairs. Before making any investment decisions, you should always conduct your own research. Chain Affairs is not responsible for any financial losses.


I’m the cryptocurrency guy who loves breaking down blockchain complexity into bite-sized nuggets anyone can digest. After spending 5+ years analyzing this space, I’ve got a knack for disentangling crypto conundrums and financial markets.