

|
Getting your Trinity Audio player ready...
|
Bitcoin [BTC] has recently reclaimed a crucial support zone between $96,475 and $99,360, setting the stage for potential bullish momentum. At press time, BTC traded at $98,079.85, marking a 0.91% decline over the past 24 hours. Despite this minor pullback, Bitcoin remains on track for further gains, with its next key resistance between $102,350 and $103,900.

Technical Analysis: Inverted Head and Shoulders Pattern Signals Strength
Bitcoin’s price chart reveals a developing inverted head and shoulders pattern—often a strong bullish signal. The cryptocurrency has been consolidating between $96,147 and $102,806, forming a resistance zone that traders are closely watching.
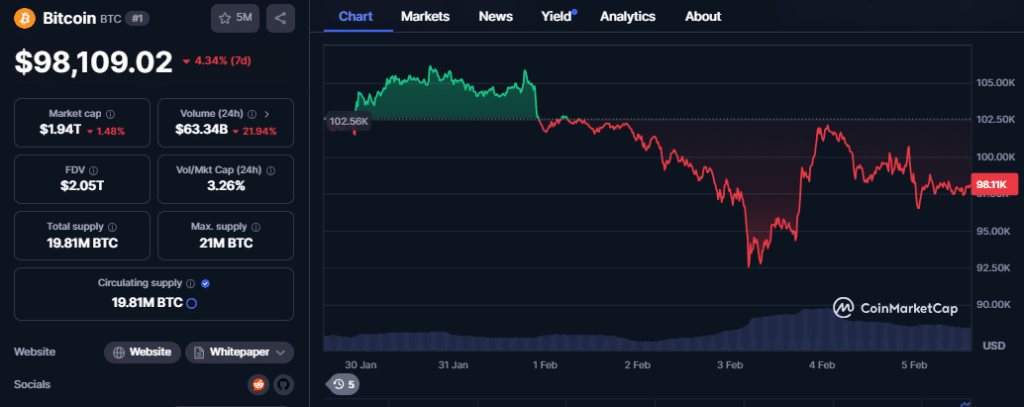
If BTC holds above the $96,147 support level, a breakout above $102,350 could push the price toward $104,000. Meanwhile, the Relative Strength Index (RSI) currently sits at 44.45, suggesting Bitcoin is nearing oversold territory. This could lead to a short-term pullback before BTC gains enough momentum to break its supply wall.
NVT Golden Cross: A Warning Sign?
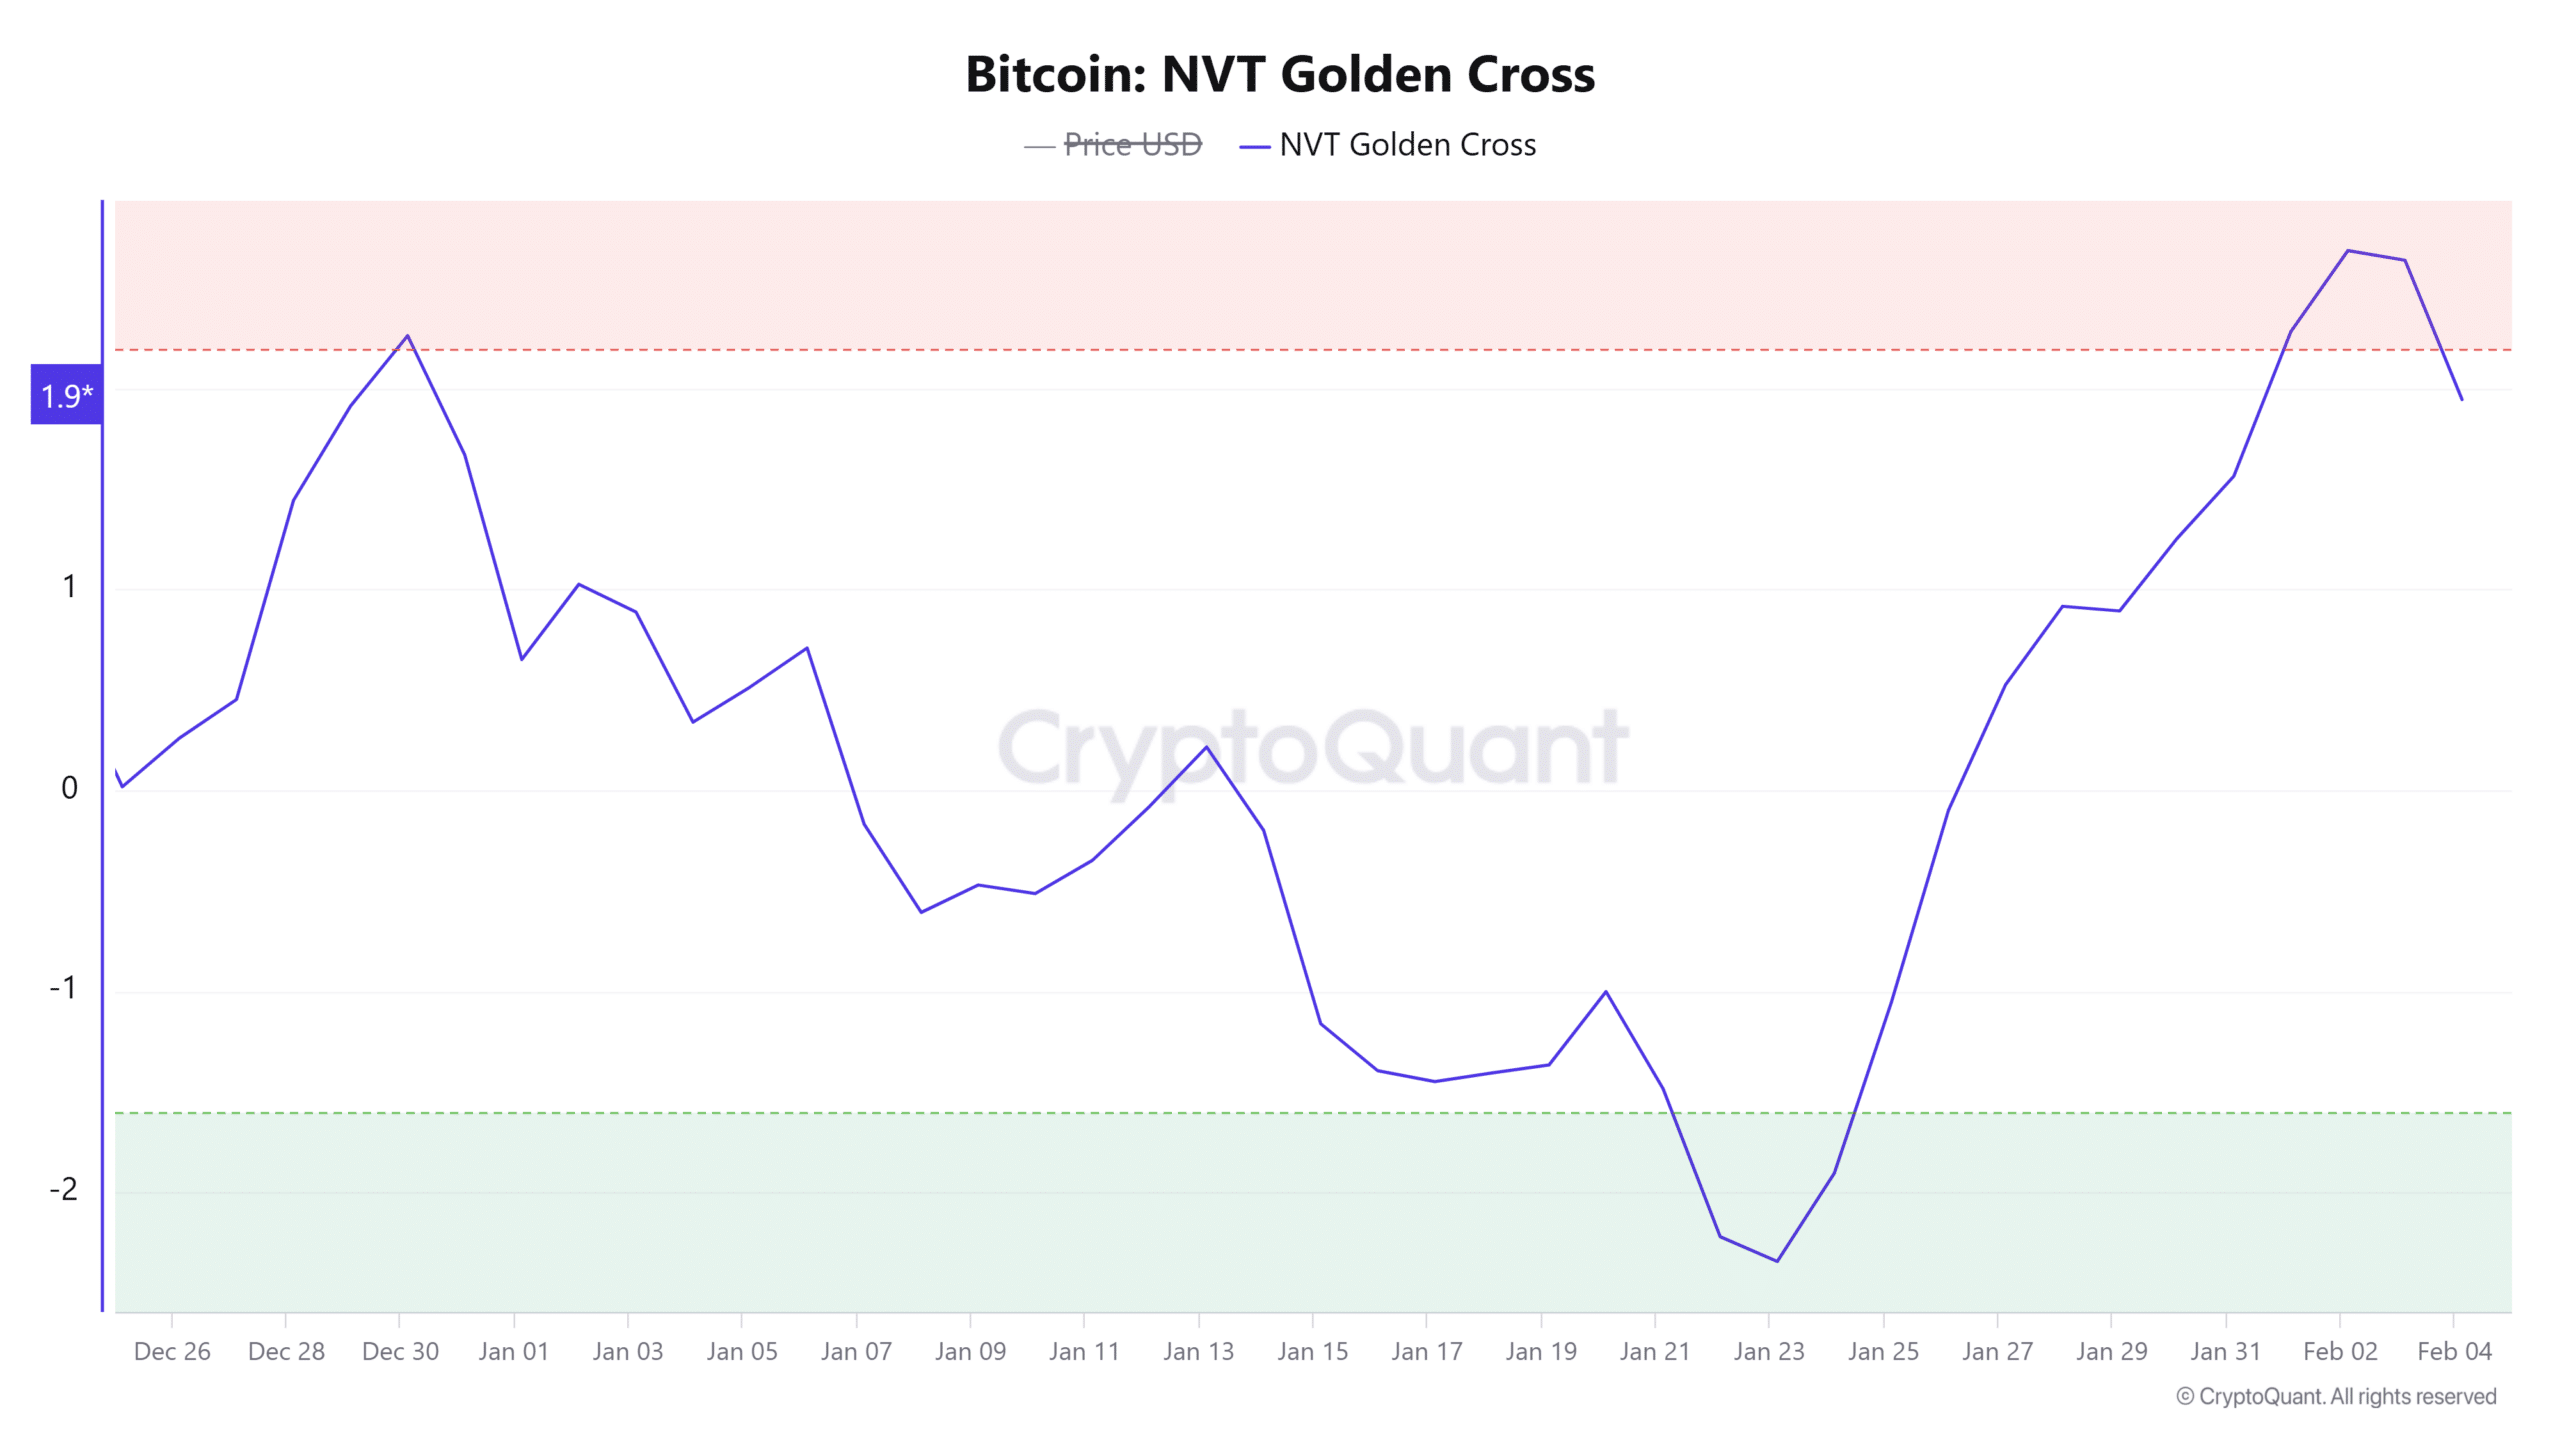
The NVT Golden Cross indicator, which assesses Bitcoin’s network value relative to transaction volume, showed a 24-hour decline of 23.09%. This suggests that BTC’s recent rally is not fully backed by strong transaction activity, raising concerns about sustainability. If transaction volumes do not pick up soon, Bitcoin may experience a brief correction before resuming its uptrend.
Bulls vs. Bears: Who Will Prevail?
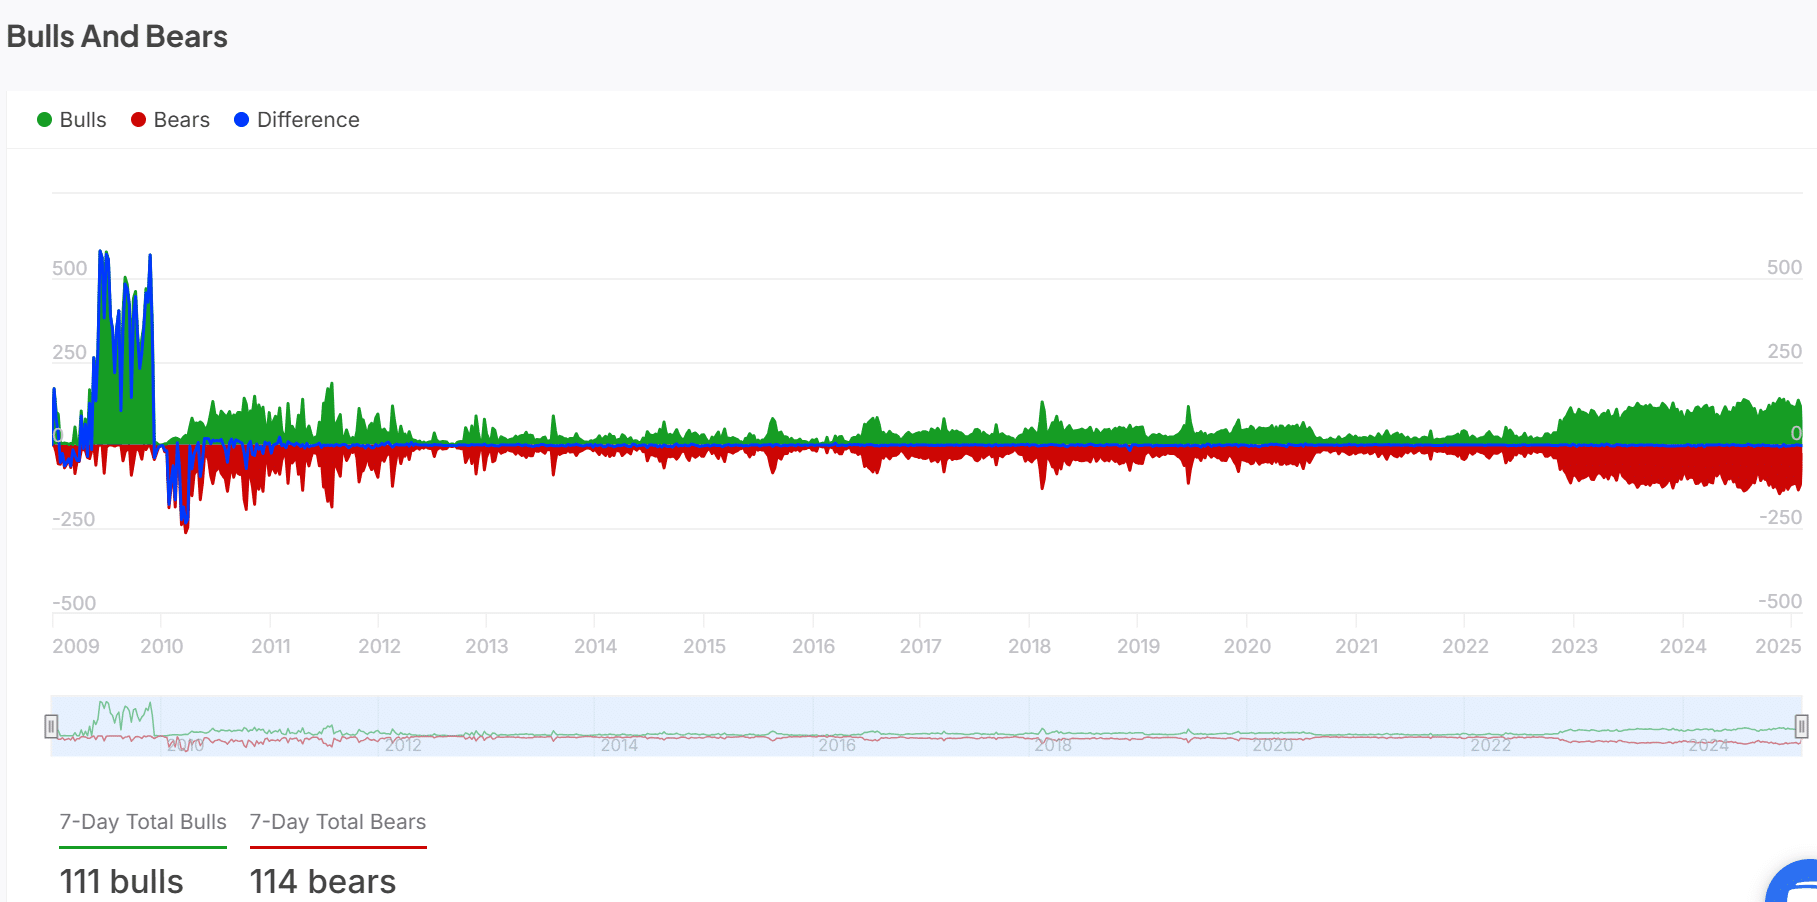
Market sentiment remains tightly contested, with 111 bulls versus 114 bears in the past week. While Bitcoin’s price action leans bullish, resistance from bears could pose challenges near the $102,350 mark. The outcome of this battle will determine whether BTC can continue climbing or face a temporary pullback.
Data from the Long/Short Ratio shows that 54.84% of traders are short on Bitcoin, compared to 45.16% who are long. This indicates that many traders expect a price correction before BTC breaks through resistance. Given Bitcoin’s historical volatility, uncertainty remains high among market participants.
Despite some bearish sentiment, Bitcoin’s overall technical structure suggests that a breakout above $102,350 is likely. However, weak transaction volume and continued resistance from bears could lead to short-term fluctuations before BTC establishes a clear upward trend. Traders should brace for volatility as Bitcoin inches closer to the critical supply wall.
Disclaimer: The information in this article is for general purposes only and does not constitute financial advice. The author’s views are personal and may not reflect the views of Chain Affairs. Before making any investment decisions, you should always conduct your own research. Chain Affairs is not responsible for any financial losses.
I’m your translator between the financial Old World and the new frontier of crypto. After a career demystifying economics and markets, I enjoy elucidating crypto – from investment risks to earth-shaking potential. Let’s explore!


