
|
Getting your Trinity Audio player ready...
|
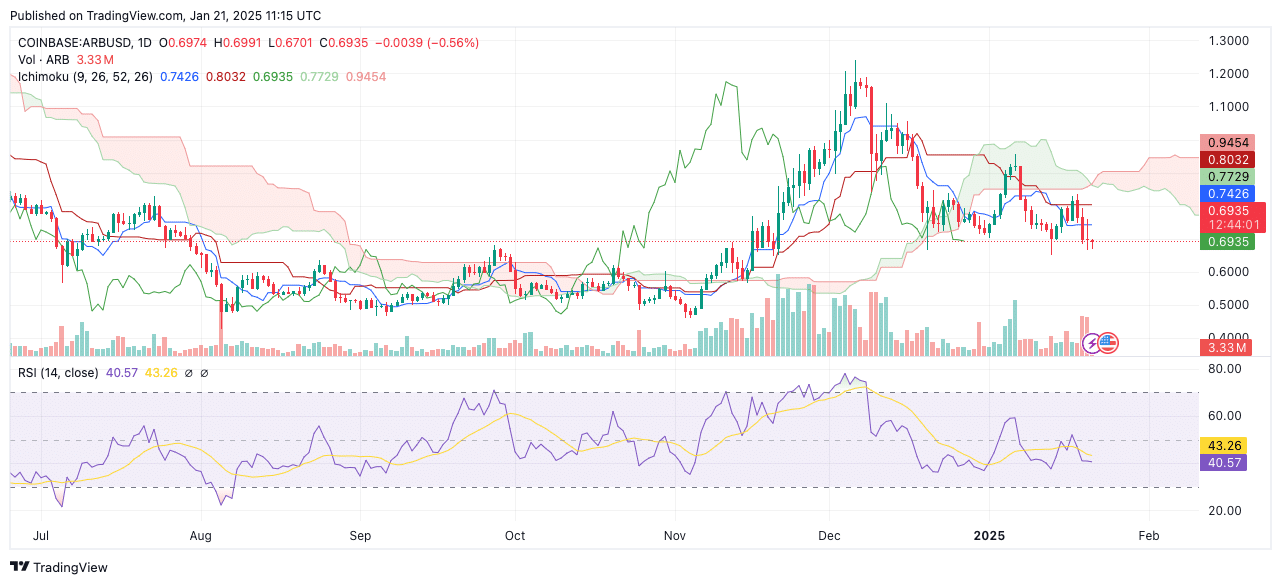
Arbitrum (ARB) has recently been trading within a classic descending triangle pattern, a chart structure often associated with potential breakout opportunities. Analysts are closely watching the asset, with a 46% price rally forecasted if ARB manages to break out from its current consolidation. As of the latest data, ARB is priced at $0.7066, marking a 3.51% decline over the past 24 hours. Despite this short-term downturn, ARB’s market cap stands at $3.05 billion, with a circulating supply of 4.3 billion tokens.
#Arbitrum $ARB looks prime for a 46% upswing if it breaks out of this descending triangle! pic.twitter.com/V4dZ1a9hAo
— Ali (@ali_charts) January 21, 2025
Key Support and Resistance Levels
The ARB/USDT chart shows critical support near the $0.6890 level, which is crucial for stability. Should ARB fail to hold above this support, the price could potentially drop to $0.6500, a psychological support level. On the upside, immediate resistance lies at $0.78, where the descending trendline has repeatedly rejected upward movements. Fibonacci retracement levels at $0.8661 (0.618) and $0.9077 (0.786) represent additional hurdles for any upward momentum. If ARB can surpass these levels, analysts project an upward trajectory toward $1.0690 and potentially beyond.
Technical Indicators Suggest Bearish Momentum
Technical indicators are currently aligned with a bearish short-term outlook for ARB. The Ichimoku Cloud analysis reveals the price trading below the cloud, signaling prevailing bearish momentum. Furthermore, key resistance levels have formed at $0.7426 (Tenkan-sen) and $0.8032 (Kijun-sen). The Relative Strength Index (RSI) sits at 40.57, just above oversold territory, which suggests weak momentum but no immediate signs of bullish reversal.
On-Chain Metrics Reflect Declining Participation
On-chain data also indicates a bearish sentiment. According to IntoTheBlock, Net Network Growth is at -1.10%, signaling reduced new participant activity. Additionally, large transaction activity remains subdued, with just 234 transactions recorded in the past 24 hours. This lack of investor interest has contributed to ARB’s price stagnation.
Despite the bearish signals, analysts remain optimistic about a potential breakout from the descending triangle. If ARB can reclaim the $0.74 level and break above its trendline resistance, analysts project upside targets at $1.0690, $1.3053, and $1.5804. With the next move crucial for ARB’s medium-term trajectory, traders are keeping a close watch for any signs of a breakout.
💰 $ARB is showing a bullish recovery setup 🚀#ARB Descending Channel breakout expected, aiming for upside targets 📈
— Rose Premium Signals 🌹 (@VipRoseTr) January 20, 2025
🎯1TP: 1.0690$
🎯2TP: 1.3053$
🎯3TP: 1.5804$ pic.twitter.com/1kR2YeNxzc
Disclaimer: The information in this article is for general purposes only and does not constitute financial advice. The author’s views are personal and may not reflect the views of Chain Affairs. Before making any investment decisions, you should always conduct your own research. Chain Affairs is not responsible for any financial losses.
Also Read: Arbitrum (ARB) Price Holds Crucial Support Amid Market Pullback: What’s Next?