|
Getting your Trinity Audio player ready...
|
- eCash has rallied over 40% but is approaching a major resistance zone.
- Ethereum recorded its strongest July in a year, supported by steady spot ETF inflows.
- Both cryptocurrencies face important technical levels that could shape August’s trend.
The cryptocurrency market opened August with mixed signals as eCash (XEC) extended its impressive rally while Ethereum (ETH) attempted to build on its strongest monthly performance in a year. Both assets have attracted renewed investor attention, but technical indicators suggest traders may need to balance optimism with caution.
eCash has delivered standout gains over the past month, fueled by strong buying activity and growing retail interest. Meanwhile, Ethereum recovered sharply in July thanks to steady spot ETF inflows, although it still faces an important technical hurdle before confirming a broader bullish trend.
eCash Rally Approaches a Critical Test
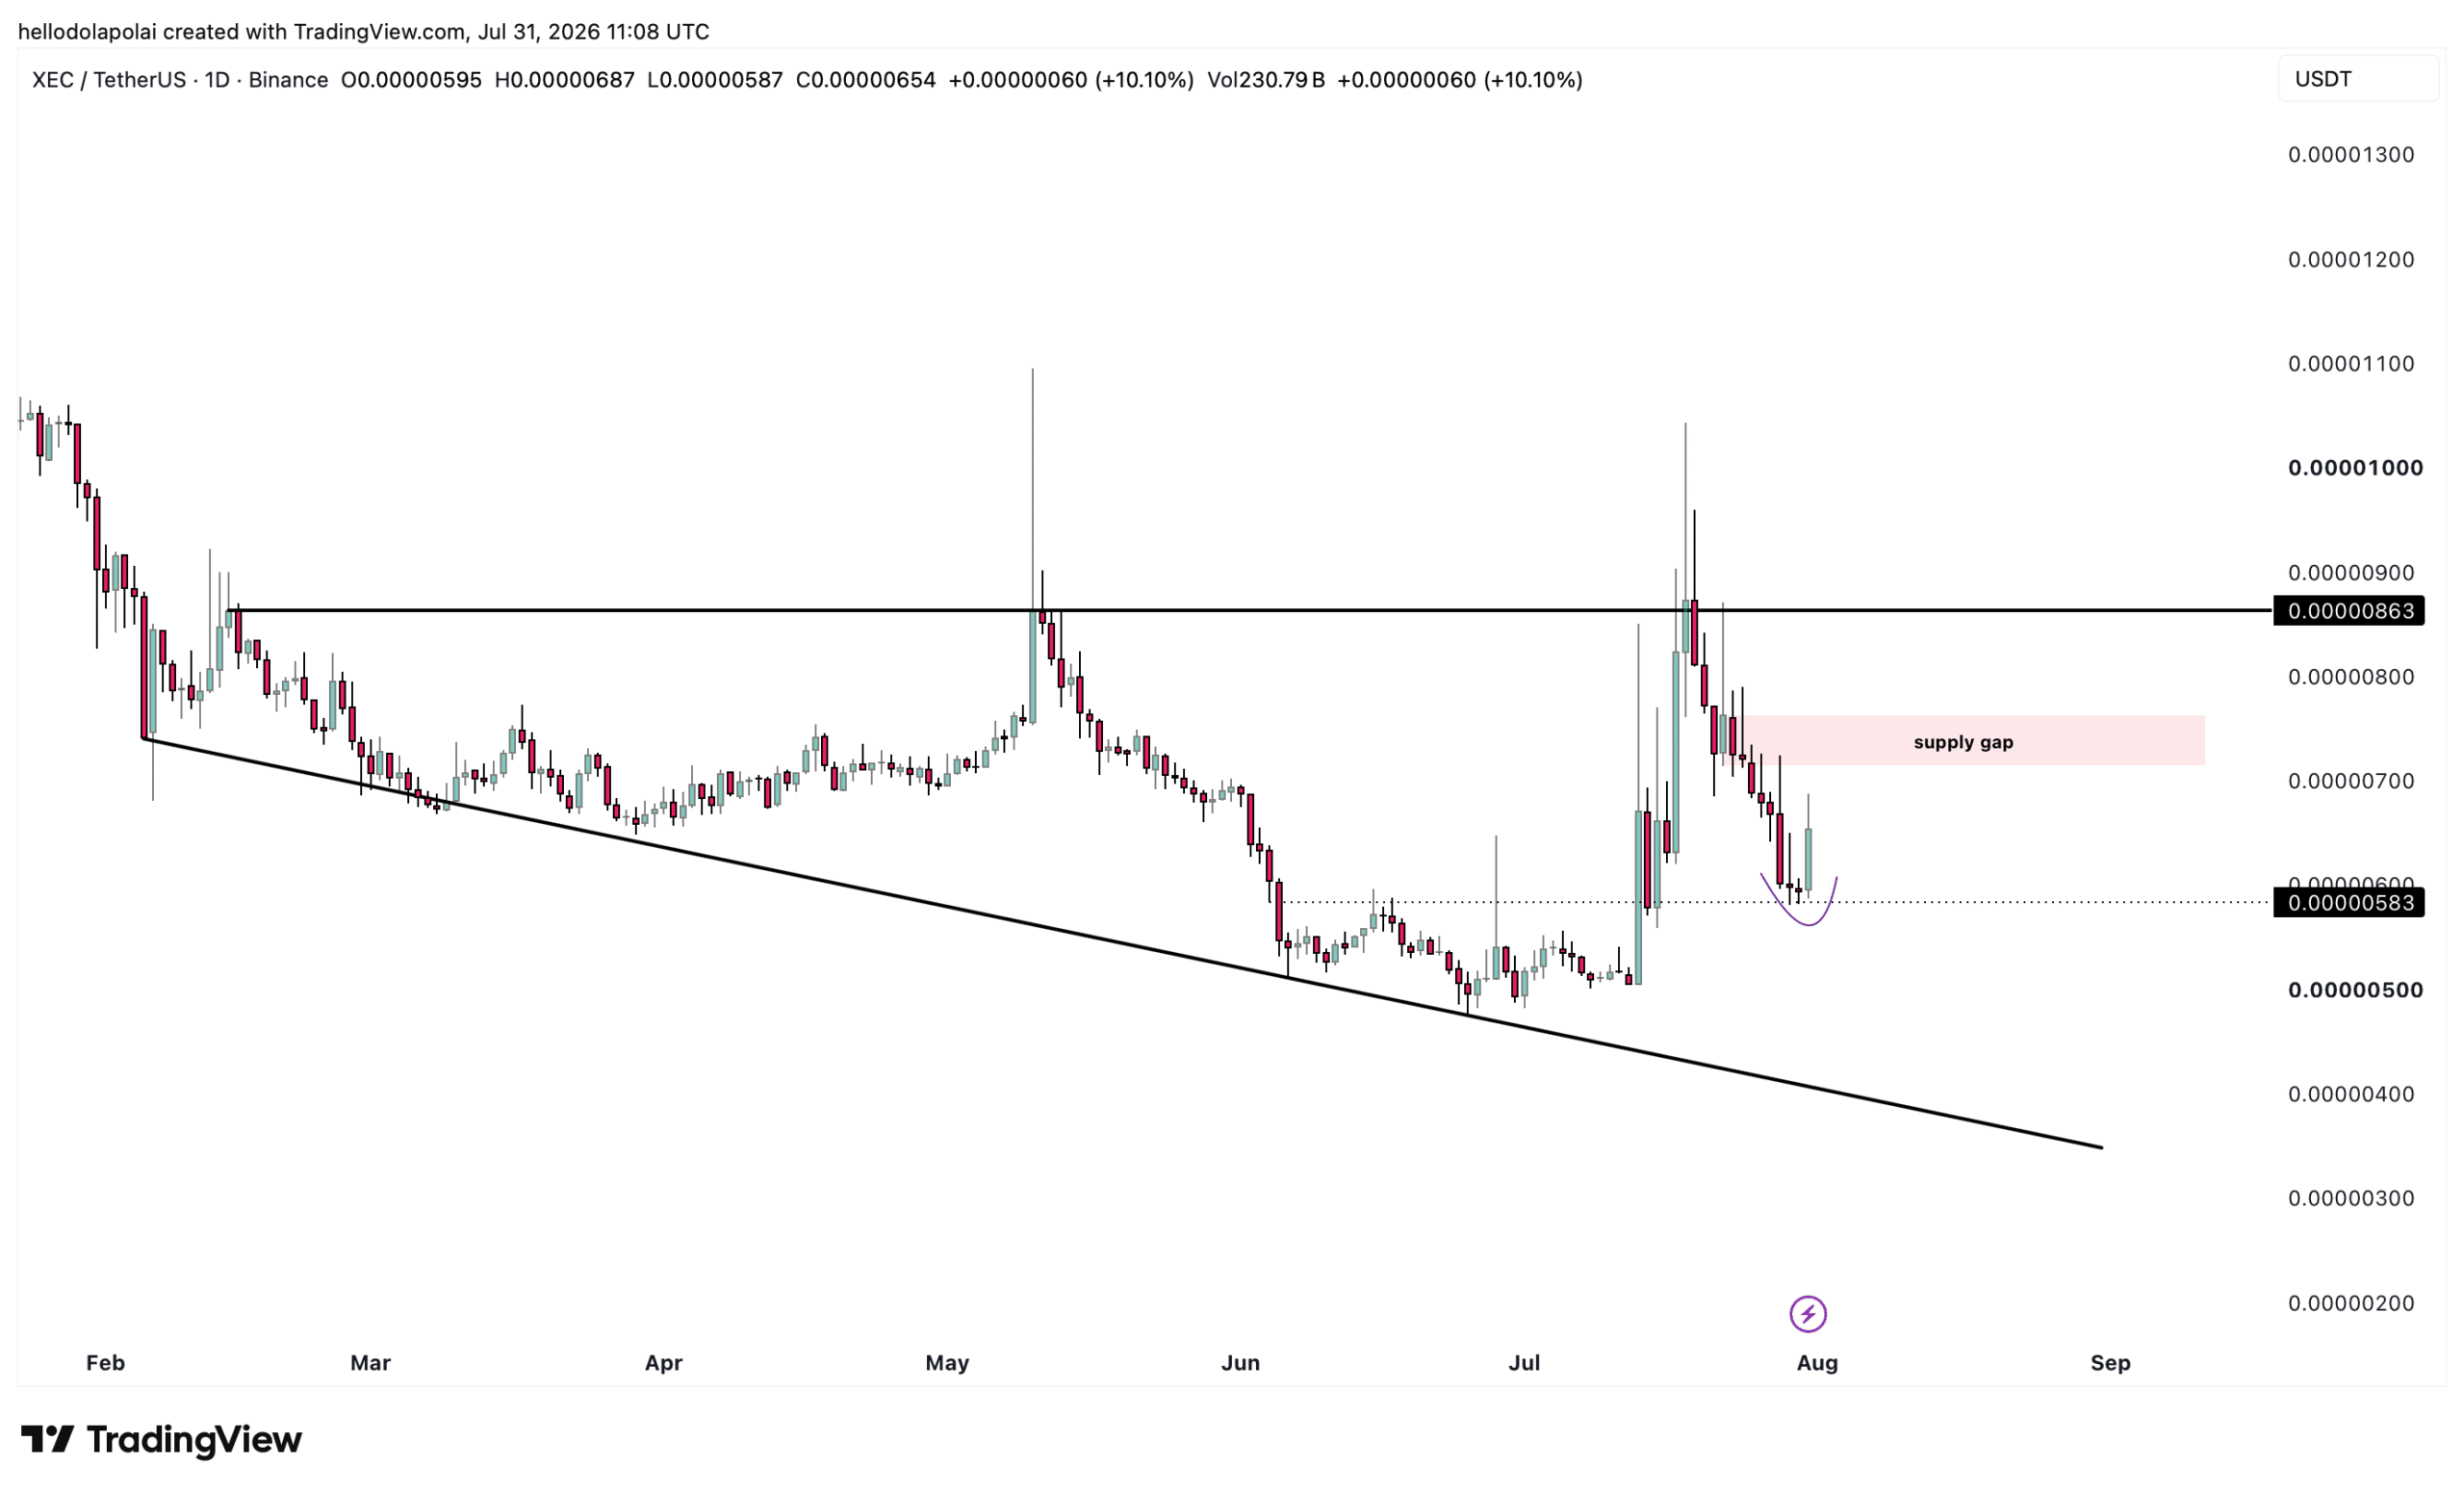
eCash has climbed more than 40% over the past 30 days, including a 14% surge within the last 24 hours, making it one of the stronger-performing altcoins in recent sessions.
The price structure continues to favor bulls, with XEC maintaining higher lows while pushing toward a significant horizontal resistance level. Such formations often support continued upside, but they can also become areas where sellers re-enter the market.
Trading activity remains strong, with daily volume jumping more than 300% to roughly $31.4 million, suggesting buyers are still actively participating.
However, the next resistance zone could determine whether the rally extends or loses momentum. A successful breakout may open the door for additional gains, while rejection could trigger a short-term correction.
Momentum Indicators Suggest Buying Pressure Is Cooling
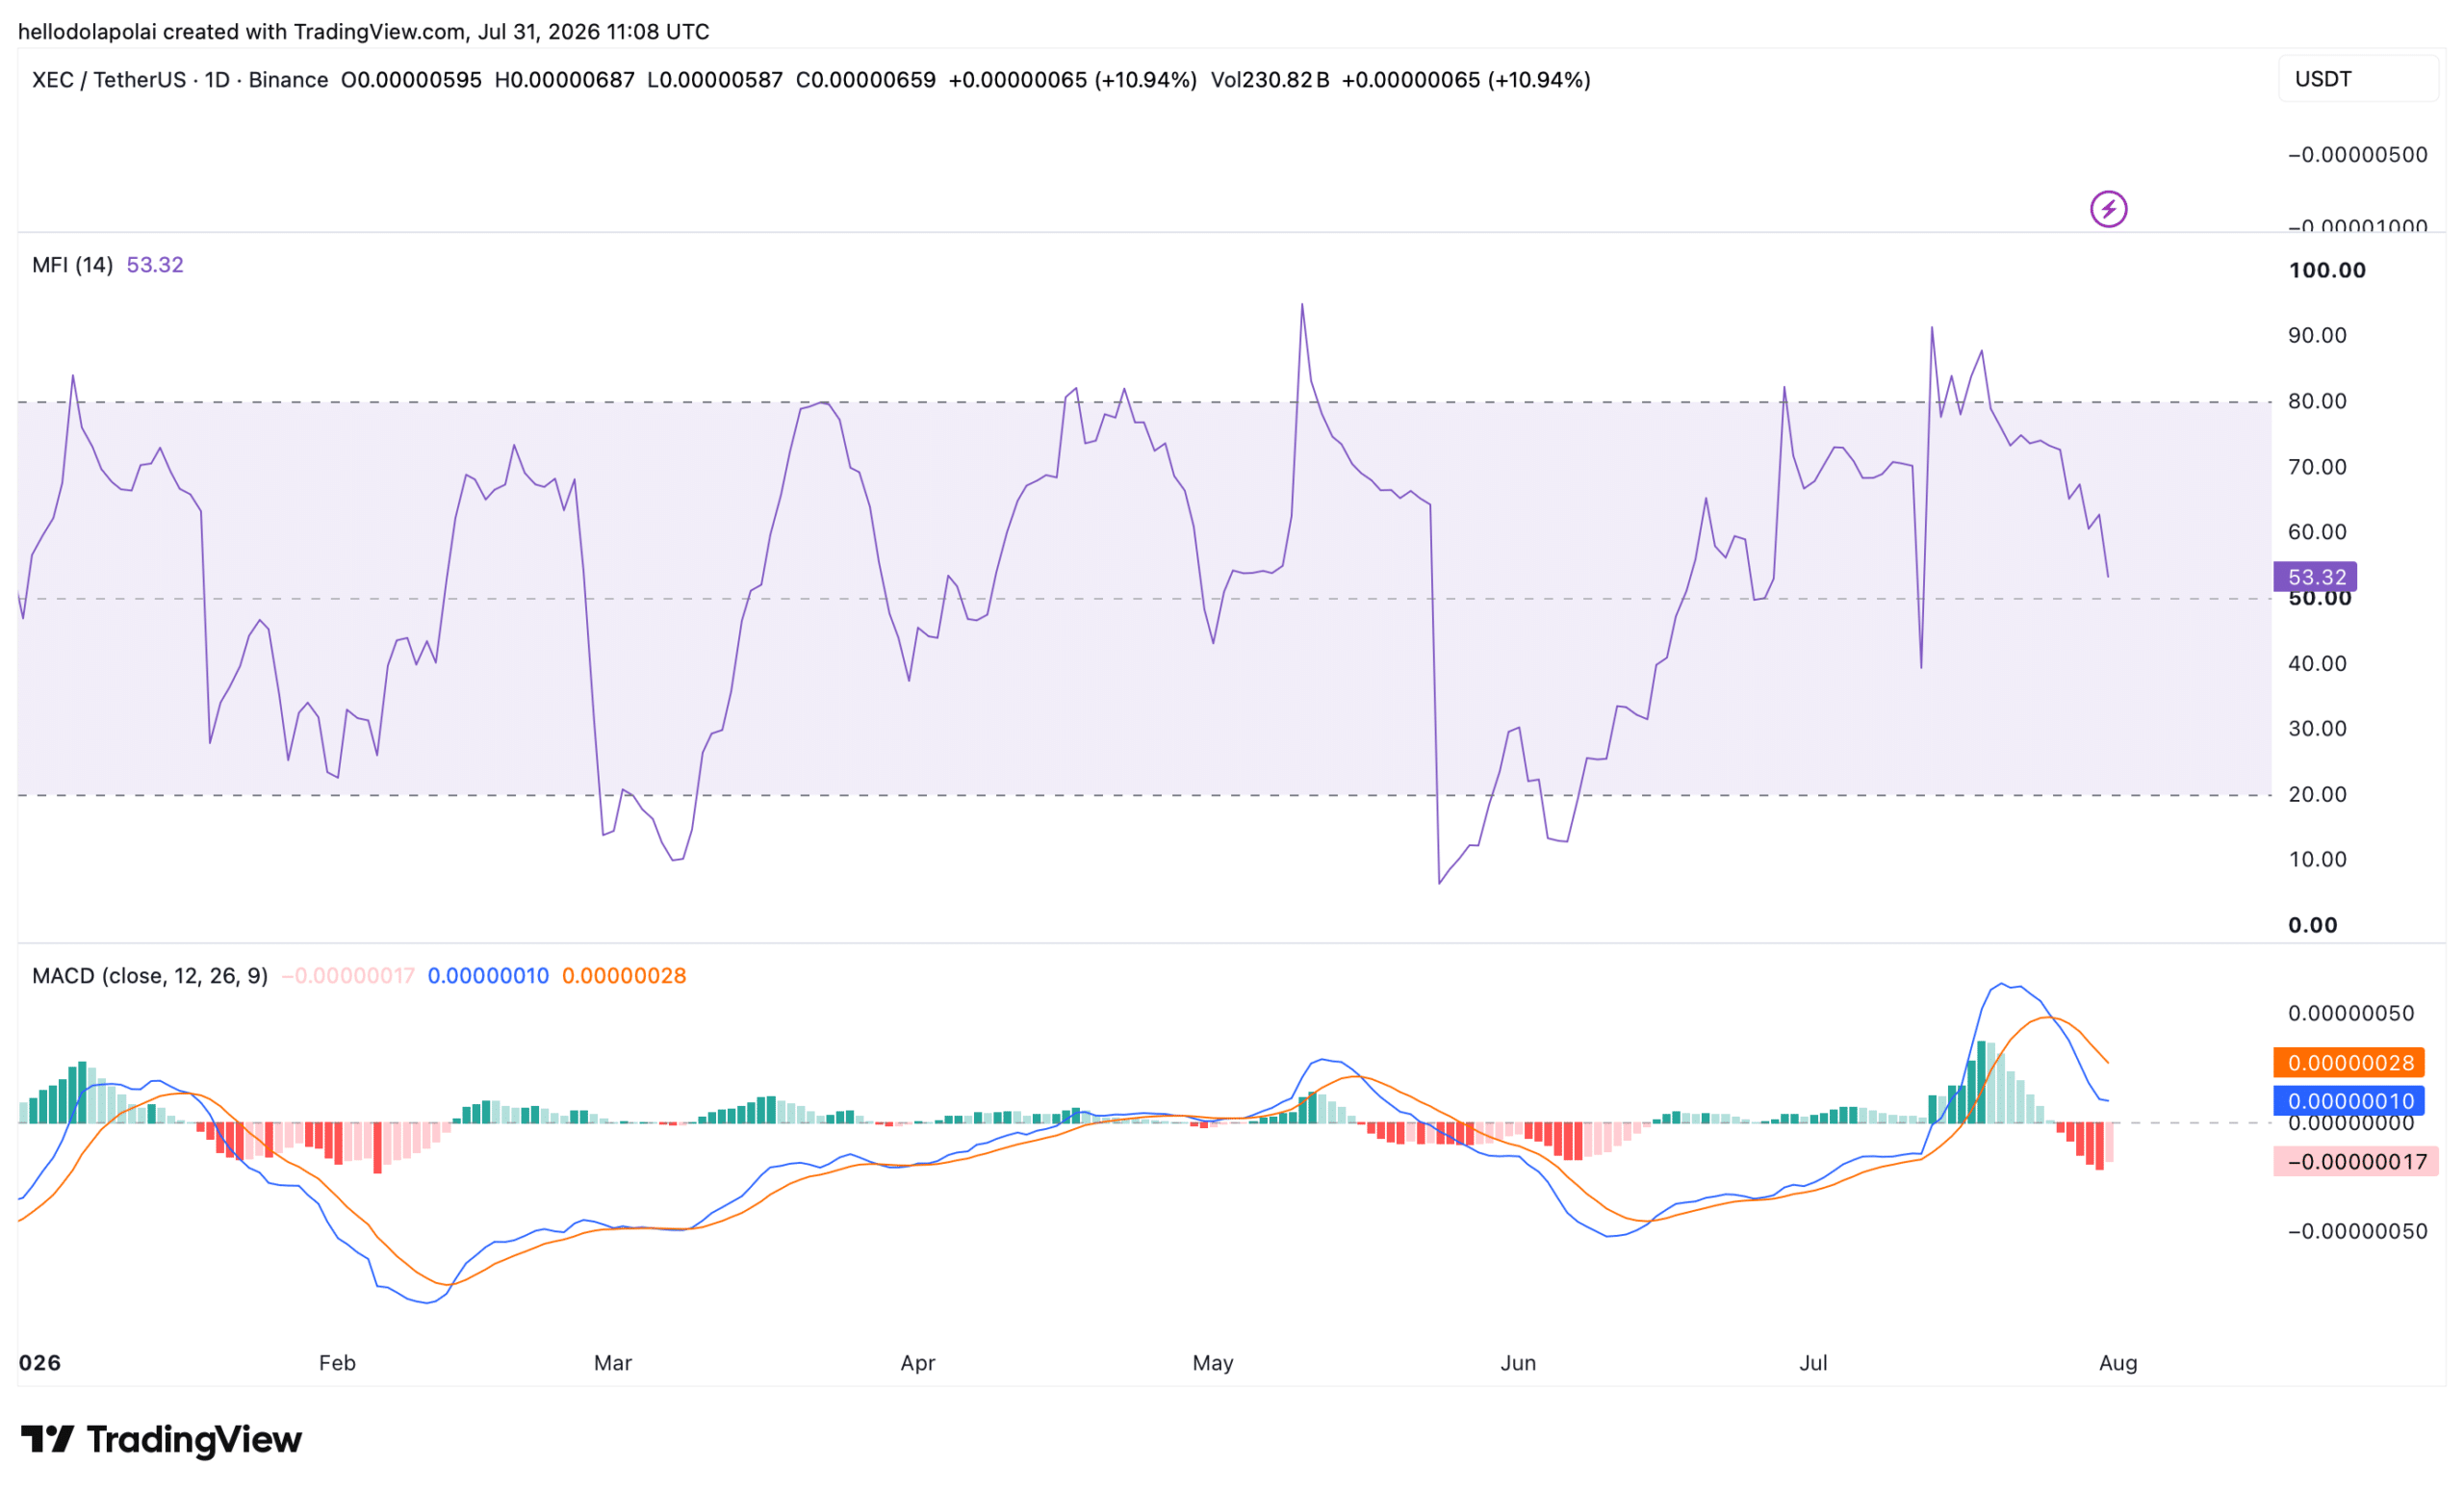
Despite the recent price strength, several technical indicators are beginning to flash early warning signs.
The Moving Average Convergence Divergence (MACD) has formed a bearish crossover, indicating bullish momentum is fading. At the same time, the Money Flow Index (MFI) points to weaker capital inflows, suggesting fresh buying demand is slowing.
Bullish trends often require continuous inflows of new capital. If demand continues to soften, buyers could gradually lose control even if prices remain elevated in the near term.
Interestingly, market sentiment remains optimistic. Social discussions surrounding XEC have increased significantly, with roughly 904 market-related posts highlighting growing retail participation. While rising community engagement can support momentum, it may also increase risk if enthusiasm outpaces fundamentals.
Ethereum Posts Best July in a Year
Ethereum also entered August with renewed momentum after recording a 20.3% gain in July, its strongest monthly performance over the past year.
The recovery reversed much of June’s steep decline and exceeded Ethereum’s historical average July return, marking a notable improvement in market sentiment.
A major driver behind the rebound was continued demand from spot Ethereum ETFs. Most trading sessions during July recorded positive net inflows, helping stabilize prices despite several short-term pullbacks.
By month-end, spot Ethereum ETFs held approximately $10.52 billion in assets, while daily net inflows reached $13.29 million, highlighting sustained institutional interest.
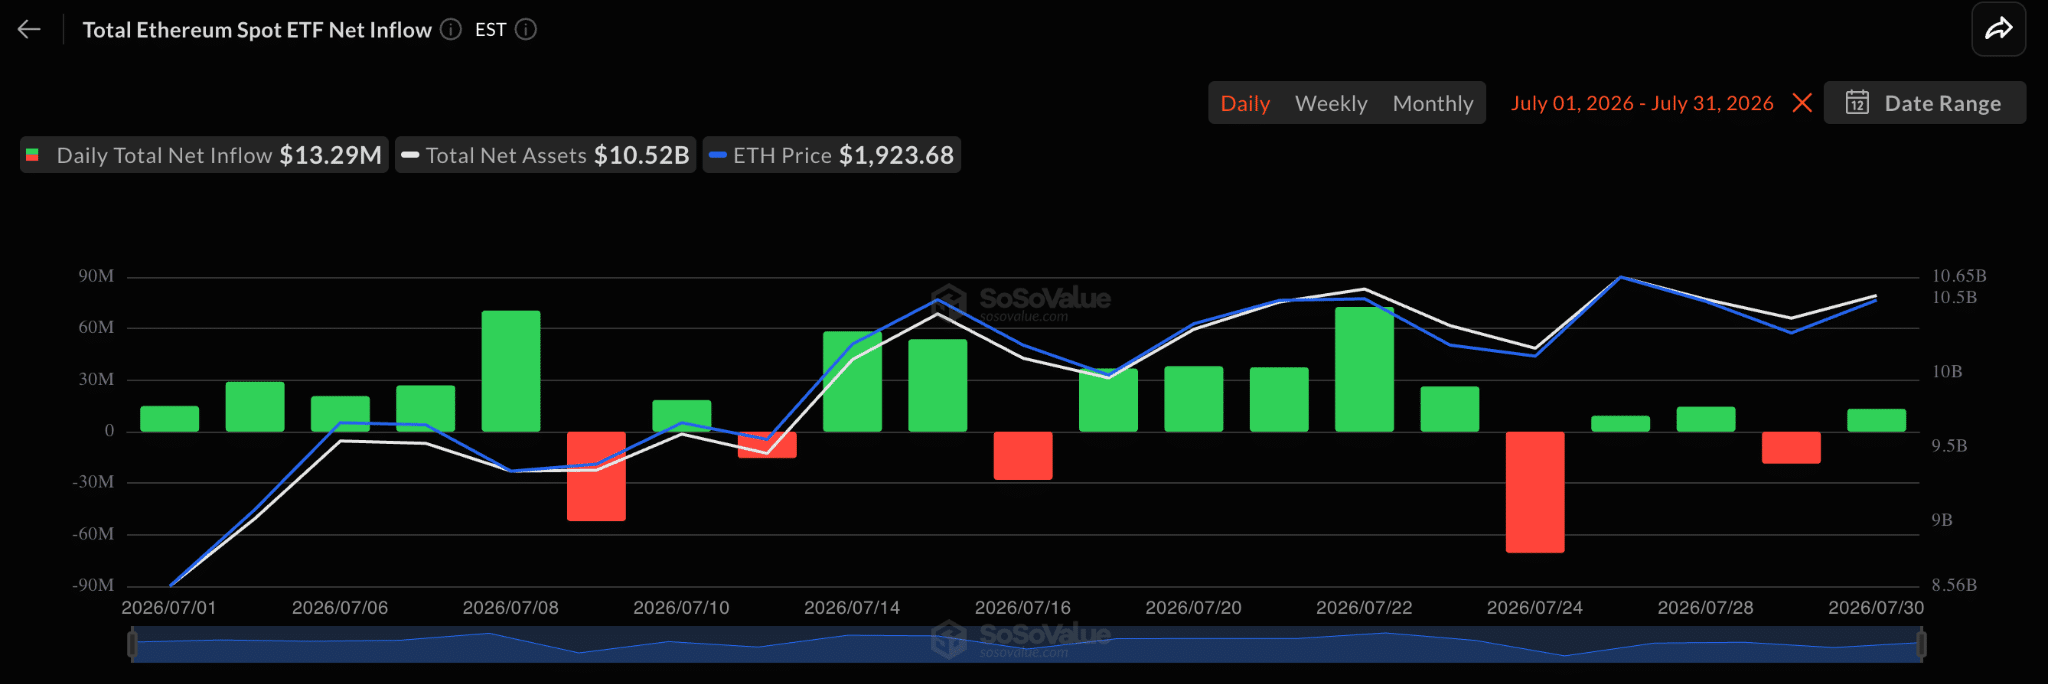
Despite July’s strong finish, Ethereum closed the month below $1,900, leaving bulls with unfinished business.
Technical indicators present a mixed outlook. The Relative Strength Index (RSI) remains near 52, signaling neutral momentum rather than strong buying pressure. Meanwhile, derivatives activity has cooled, with Open Interest declining to around $11.46 billion, suggesting traders have reduced leveraged positions.
Funding rates remain slightly positive, indicating long positions still hold a modest advantage, but conviction appears limited.
Unless Ethereum successfully reclaims the $1,900 level, analysts may continue to expect consolidation or a modest pullback before another attempt at the psychologically important $2,000 resistance.
Both eCash and Ethereum begin August with positive momentum, but each faces important technical challenges. XEC continues to benefit from strong buying interest and rising community engagement, yet weakening momentum indicators suggest the rally may soon encounter resistance. Ethereum, meanwhile, has regained investor confidence following a strong July and healthy ETF inflows, but reclaiming $1,900 remains essential before targeting higher prices.
Also Read: eCash Jumps 55% After Aster Listing: Can XEC Hit $0.00001 Again?
For now, traders will likely watch resistance levels, capital flows, and market participation closely to determine whether these recent gains can develop into longer-term uptrends.
Disclaimer: The information in this article is for general purposes only and does not constitute financial advice. The author’s views are personal and may not reflect the views of Chain Affairs. Before making any investment decisions, you should always conduct your own research. Chain Affairs is not responsible for any financial losses.

I’m your translator between the financial Old World and the new frontier of crypto. After a career demystifying economics and markets, I enjoy elucidating crypto – from investment risks to earth-shaking potential. Let’s explore!