|
Getting your Trinity Audio player ready...
|
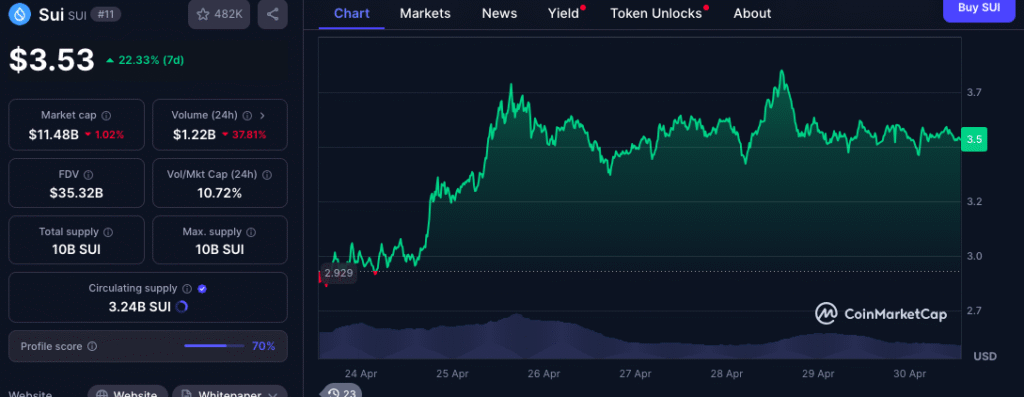
SUI/USDT has ignited the crypto market with a staggering 1,388% surge from its initial listing price, fueling fervent discussions about its future trajectory. A recent technical analysis published on April 28, 2025, suggests that the current trading price of $3.60 might merely represent a halfway point on its journey toward a bold $100 target. The detailed chart, presented by CryptoPatel on TradingView, envisions a series of expansion phases propelled by crucial Fibonacci levels and established breakout patterns, potentially extending into early 2026.
People laughed when #SOLANA was $1…
— Crypto Patel (@CryptoPatel) April 28, 2025
Will $SUI at $100 surprise everyone next?
Please share your honest review 👇#SUI #Altcoins $SOL pic.twitter.com/eXLu0nQHpb
Key Support Levels Anchor SUI’s Bullish Momentum
The technical breakdown highlights the significance of SUI’s historical price action, pinpointing clear zones where substantial buyer interest emerged, starting from a base near $0.35. Notably, support levels at $0.88 and $1.03 have demonstrated resilience during periods of consolidation, providing a solid foundation for the subsequent ascent to the current $3.60 range.
Having successfully breached key trendlines, SUI is now confronting overhead resistance near the $4.50 mark. The current chart configuration places the asset just below the identified “bull market target” of $5.45. Analysts suggest that a decisive move above this threshold could signal the commencement of another significant upward leg. This optimistic outlook is further bolstered by Fibonacci retracement and extension levels, with the 0.382 ($2.10) and 0.618 ($1.72) levels demonstrating the uptrend’s adherence to established technical boundaries, lending credence to the ambitious long-term forecast.
$100 Target Hinges on Repeating Expansion Cycles
CryptoPatel’s analysis posits a recurring bullish pattern for SUI, mirroring previous expansion phases observed in 2023 and 2024. The initial rally from $0.35 to $5.06 yielded gains exceeding 1,300%, and the projected wave structure extrapolates this pattern into two subsequent expansion zones targeting $50 and ultimately $100.
Also Read: SUI Price Surges 58% as Altcoin Market Recovers: Bullish Momentum Builds
This long-term projection incorporates trendlines drawn from past peaks and troughs, mapping a potential path extending through mid-2026. The analysis identifies phases of heightened upward market activity, indicated by green vertical zones, where significant growth is anticipated. Each projected move aligns with Fibonacci confirmations and historical price symmetry, reinforcing the hypothesis of a climb toward triple digits, provided key support levels remain intact.
While the $100 target represents a substantial increase from the current price, the detailed technical roadmap, grounded in historical behavior and repeatable chart setups, offers a compelling, albeit speculative, outlook for SUI’s future. The immediate focus remains on whether the next breakout will indeed mirror previous waves and propel SUI toward its near-term bull market target.
Disclaimer: The information in this article is for general purposes only and does not constitute financial advice. The author’s views are personal and may not reflect the views of Chain Affairs. Before making any investment decisions, you should always conduct your own research. Chain Affairs is not responsible for any financial losses.
I’m your translator between the financial Old World and the new frontier of crypto. After a career demystifying economics and markets, I enjoy elucidating crypto – from investment risks to earth-shaking potential. Let’s explore!