

|
Getting your Trinity Audio player ready...
|
XRP has spent the better part of a decade trapped inside the same chart pattern. Now, after a brutal year of selling pressure, the token appears to have completed a technical retest that traders have been watching since 2018 — and it’s starting to turn heads again.
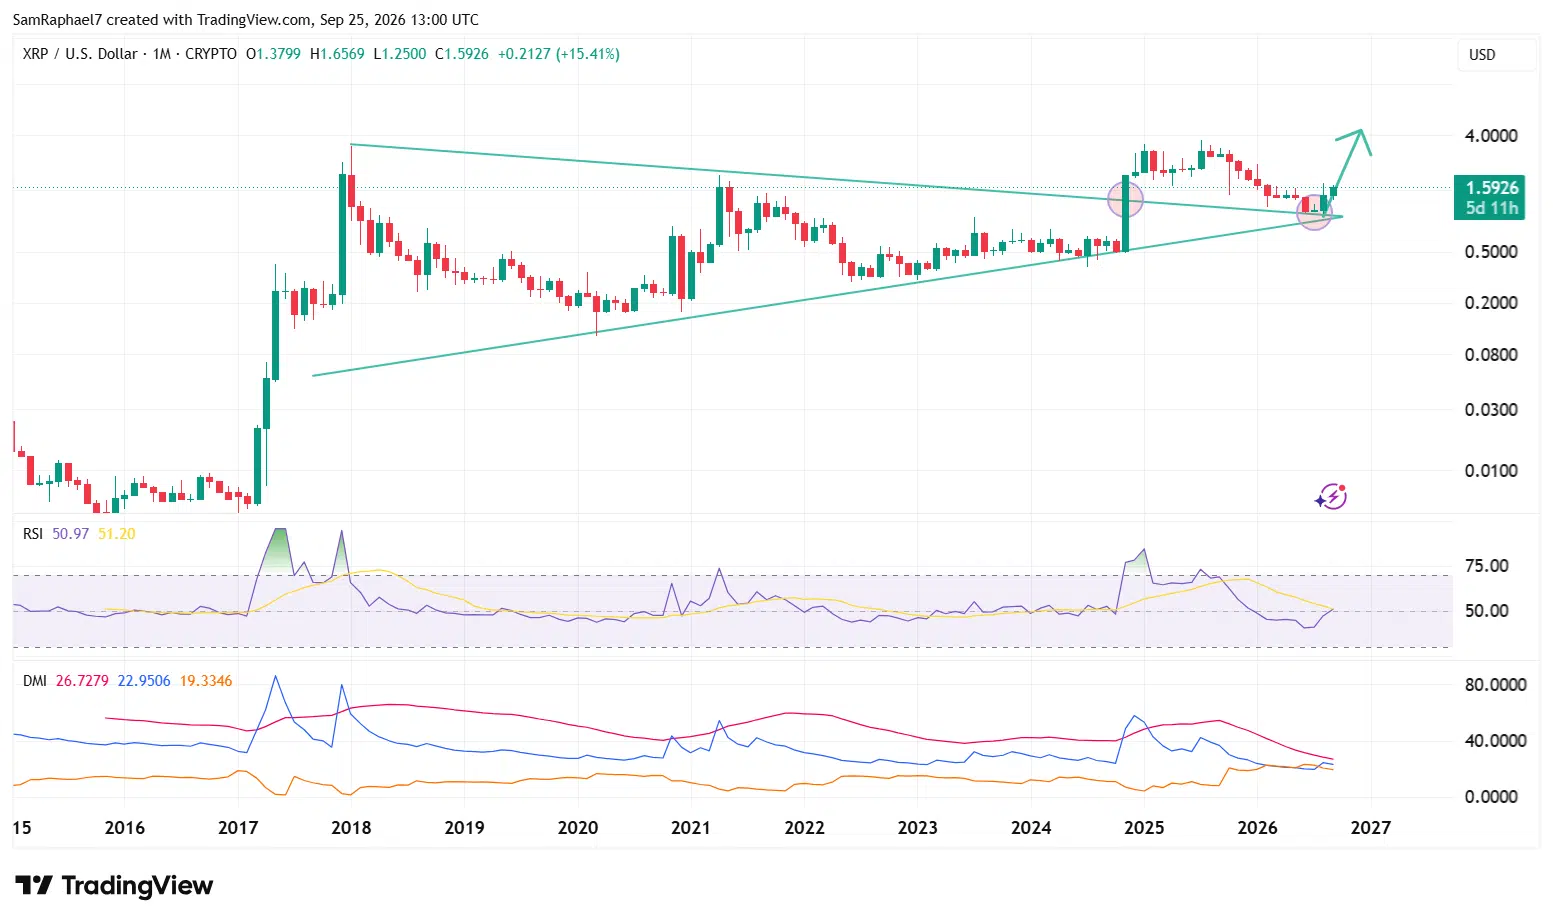
Since bottoming in July 2026, XRP has climbed more than 54%, pushing back above $1.60. That number matters more than it might seem, because it marks the completion of a retest on a symmetrical triangle pattern that’s been forming for roughly seven years.
A Chart Pattern Seven Years in the Making
The triangle traces back to January 2018, when XRP peaked at $3.31 before entering a long, painful decline. It tried to break out during the 2021 bull run, climbing to $1.96, but resistance held firm and the token failed to reclaim its old highs — even as the rest of the crypto market surged. Much of the blame fell on the SEC’s lawsuit against Ripple, filed in December 2020, which hung over the token for years and kept buyers cautious.
That overhang finally lifted in 2024. A federal judge ruled that XRP itself isn’t a security, and the token rode that clarity — plus a broader market rally following the 2024 U.S. election — into a genuine breakout. XRP cleared $1, then $2, then $3, eventually hitting an all-time high near $3.4 in early 2025.

From New Highs to a Long Retest
After that peak, XRP pulled back to retest the $1.60 zone before rallying again to a fresh high above $3.6 by mid-2025. But the good times didn’t last. Starting in August 2025, XRP entered a sustained downtrend, falling in seven of the following eight months as selling pressure spread across crypto markets.
That decline eventually dragged XRP down to roughly $0.98 by August 2026 – a drop that, technically speaking, brought the token back down to retest the upper trendline of its original triangle breakout. It’s this retest that now appears to be complete, with XRP recovering more than 63% since that low.
Also Read: XRP Whales Add $2.2B in Holdings as Price Eyes $1.60 Supply Wall
What the Indicators Are Showing Now
The technical picture is backing up the price action. XRP’s monthly RSI sits near 51, suggesting the current uptrend still has room to run without being overextended. Momentum indicators tell a similar story: the ADX reading of roughly 26.7, paired with the +DI holding above the -DI, points to a trend with real strength behind it rather than a short-lived bounce.
None of this guarantees XRP will reclaim its old highs. Resistance around $2 and $3 previously proved difficult to overcome, and crypto markets rarely move in straight lines. But with a multi-year technical retest now behind it and momentum indicators aligned, XRP finds itself at a point where the next move could matter a lot more than usual.
Disclaimer: The information in this article is for general purposes only and does not constitute financial advice. The author’s views are personal and may not reflect the views of Chain Affairs. Before making any investment decisions, you should always conduct your own research. Chain Affairs is not responsible for any financial losses.


I’m your translator between the financial Old World and the new frontier of crypto. After a career demystifying economics and markets, I enjoy elucidating crypto – from investment risks to earth-shaking potential. Let’s explore!