|
Getting your Trinity Audio player ready...
|
- USDT dominance peaked near 4.65% but faced repeated rejections.
- Prior support at 4.3% now acts as critical rebound zone.
- Broken rising wedge pattern highlights range-bound market behavior.
Stay ahead with real-time updates and insights—Join our Telegram channel!
USDT dominance has seen a turbulent few weeks, showcasing distinct phases that highlight both bullish recoveries and bearish setbacks. Recent technical analysis shows the market oscillating between strong resistance near 4.65% and lower support zones around 4.3%, reflecting the classic dynamics of a broken rising wedge pattern. Traders closely watching stablecoin dominance may find valuable insights in these structured moves.
A Series of Distinct Phases on the Four-Hour Chart
Data from the four-hour USDT dominance chart reveals a clear sequence of events. The trend began with a downward slide before building a base at lower levels. From there, the market reversed into an ascending pattern, forming higher lows and peaks that created a structured channel. This initial climb indicated growing strength in USDT relative to other cryptocurrencies, but the momentum would soon face a significant challenge.
Resistance Forms Around 4.65%
As the upward channel progressed, USDT dominance approached the 4.65% region. Analysts from Crypto Scient note multiple rejections at this level, confirming strong resistance. The repeated inability to breach this ceiling weakened momentum and ultimately caused the ascending trendline to break. The breakdown signaled the end of the prior upward move and set the stage for a corrective phase.
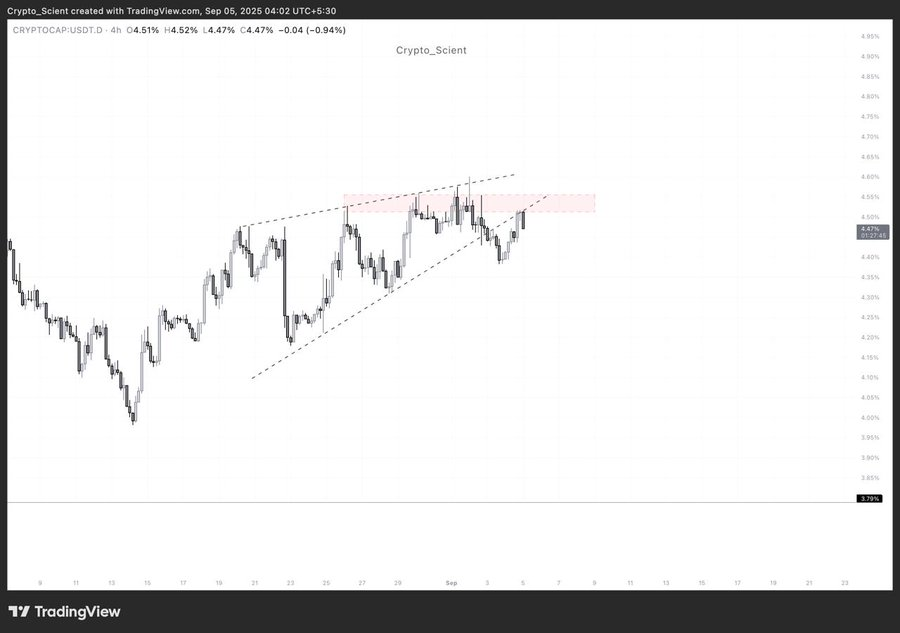
Retesting Prior Support as New Resistance
Following the breakdown, dominance retreated sharply to the 4.3% area, then attempted a recovery toward 4.5–4.55%. This movement brought the chart into a retest phase, where the prior support zone converted into new resistance. Candlestick activity within this red box shows hesitation, as dominance repeatedly stalls below the overhead supply cluster. This aligns with a common technical pattern where broken structures act as resistance during subsequent rebounds.
The broader pattern indicates a completed rising wedge that has broken downward. The rebound into the red box zone confirms the significance of the 4.55% region, which continues to cap dominance. Market swings now remain confined between lower supports and the overhead cluster, highlighting the cautious stance traders must take while monitoring stablecoin dynamics.
Stay ahead with real-time updates and insights—Join our Telegram channel!
Conclusion
USDT dominance remains trapped in a contested range, battling resistance at 4.55–4.65% after a clear rising wedge breakdown. Investors should watch for a decisive move above or below these levels, as it may signal the next directional trend for stablecoins relative to broader crypto markets.
Also Read: Tether Invests $200M in Gold Mining: XAUT Surges as Gold Prices Hit Record Highs
I’m your translator between the financial Old World and the new frontier of crypto. After a career demystifying economics and markets, I enjoy elucidating crypto – from investment risks to earth-shaking potential. Let’s explore!