
|
Getting your Trinity Audio player ready...
|
Stellar (XLM) has slipped 5.91% over the past week to $0.2637, but chart patterns and technical analysis suggest the cryptocurrency may be poised for a bullish reversal. Market participants are closely watching support and resistance levels that have defined XLM’s recent price action.
Accumulation Builds Base at $0.26
Since mid-April, Stellar has traded within a narrow range of $0.24 to $0.30, forming a reliable support zone around $0.26. Despite muted trading volumes, the consistency of buyer interest at these levels suggests steady accumulation rather than distribution. Every pullback toward $0.26 has attracted new buyers, reinforcing the strength of this foundation.
Resistance near $0.30 has repeatedly capped upward moves, with multiple failed breakout attempts in May. However, the persistent buying pressure just below this ceiling hints that sellers may be losing dominance, setting the stage for a potential breakout.
Technical Patterns Suggest Reversal in Sight
According to Rose Premium Signals, XLM is showing signs of a trend reversal as it bounces from key support. A falling wedge breakout on the 4-day chart remains valid, often a bullish indicator suggesting that consolidation may be giving way to upward momentum.
♾ #XLM/USDT 4D OUTLOOK$XLM is bouncing off key support and setting up for a trend reversal. The falling wedge breakout remains valid — all eyes on Fibonacci retracement levels for confirmation.
— Rose Premium Signals 🌹 (@VipRoseTr) June 1, 2025
🎯 Target 1: $0.4594
🎯 Target 2: $0.5601
🎯 Target 3: $0.6719
Structure still… pic.twitter.com/IKarpnjvx8
Fibonacci retracement levels around 0.5 and 0.618—commonly used by traders to identify trend continuations—are acting as pivot zones. If the current support holds, XLM could target price levels at $0.4594, $0.5601, and $0.6719, aligning with previous resistance areas and Fibonacci projections.
Indicators Flash Mixed Signals Amid Low Momentum
Despite the promising chart setup, XLM continues to trade below its 20-day EMA ($0.2805) and 50-day EMA ($0.2789), signaling caution in the short term. Until these levels are reclaimed, upside momentum may remain capped.
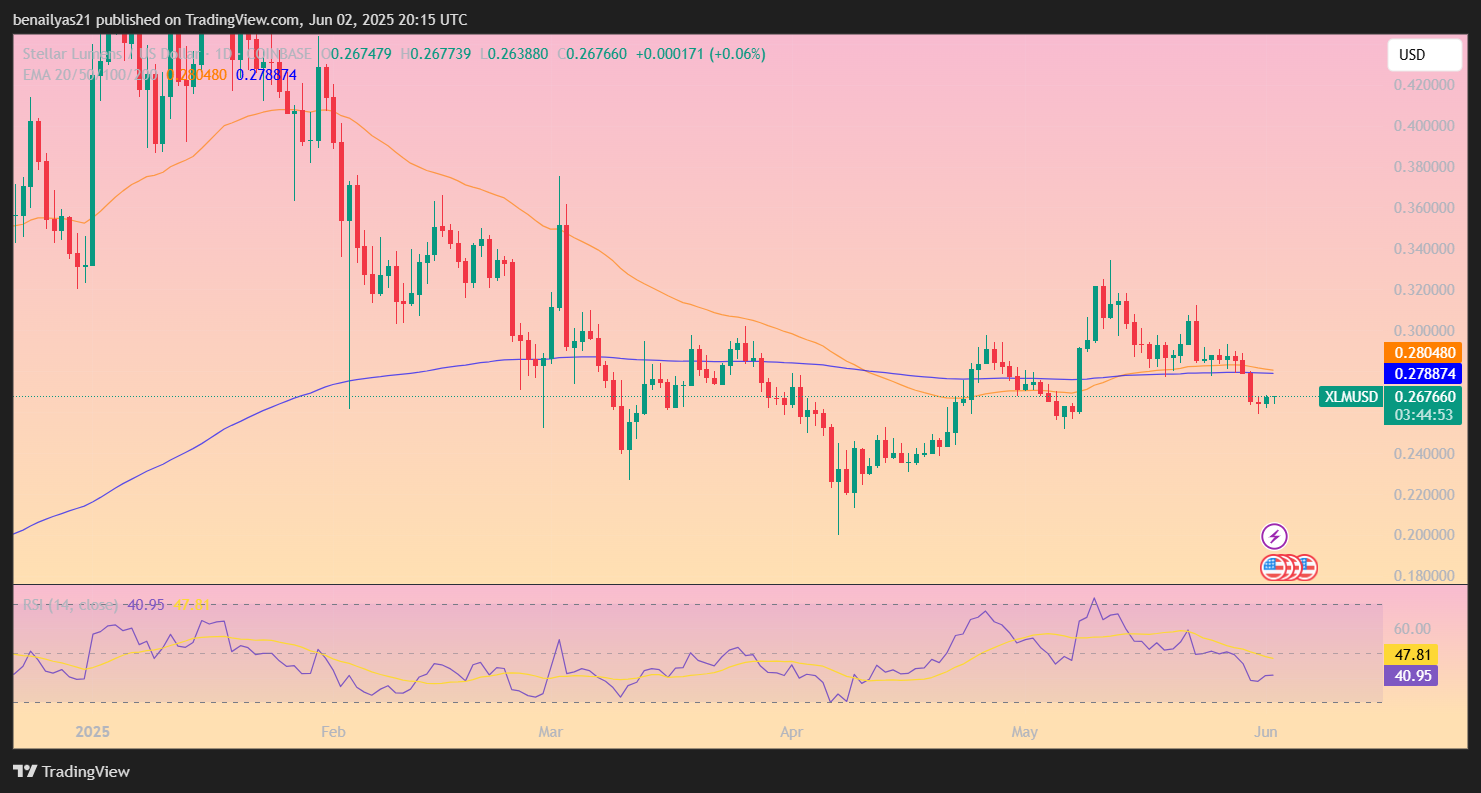
The Relative Strength Index (RSI) stands at 40.95, reflecting ongoing bearish sentiment. Bollinger Bands also indicate limited volatility, with prices hugging the lower band. Meanwhile, the MACD shows fading momentum, with both the MACD and signal lines below zero and no bullish crossover in sight.
For now, Stellar appears to be in a holding pattern—but if technical support remains firm, a breakout could shift sentiment sharply bullish.
Disclaimer: The information in this article is for general purposes only and does not constitute financial advice. The author’s views are personal and may not reflect the views of Chain Affairs. Before making any investment decisions, you should always conduct your own research. Chain Affairs is not responsible for any financial losses
Also Read: Stellar (XLM) Price Teeters at $0.28 as Market Volatility Rises
I’m your translator between the financial Old World and the new frontier of crypto. After a career demystifying economics and markets, I enjoy elucidating crypto – from investment risks to earth-shaking potential. Let’s explore!