
|
Getting your Trinity Audio player ready...
|
- SOL reclaimed its 200-day MA, but $88 and $98 remain important levels for continued upside.
- XRP could have more recovery room, with its 200-day MA near $1.27 offering a potential 17.5% move.
- Bitcoin and U.S. PCE inflation data could determine whether the broader crypto rally continues.
Bitcoin’s latest surge has reignited momentum across the altcoin market, with Solana (SOL) and XRP among the biggest large-cap beneficiaries. Both tokens climbed roughly 10% on August 19, but their chart structures tell very different stories.
SOL has regained a key long-term technical level and pushed to a three-month high, while XRP remains below its 200-day moving average despite its sharp rebound. That divergence could become important if the broader crypto rally continues.
SOL Flips Bullish but Faces a Key Test
Solana climbed from around $80 to a high of $87.20, moving back above its 200-day moving average for the first time since November. The move also took SOL beyond its July peak, strengthening the bullish case.
Still, the rally has not completely broken SOL out of its 2026 range of $76 to $98. A sustained move above the $88 mid-range level would be an important confirmation of strength.
If SOL can establish $88 as support and eventually clear $100, the token could continue recovering some of the losses recorded in 2025. A return to the $98 range high would represent another potential 16% move from the levels highlighted in the analysis.

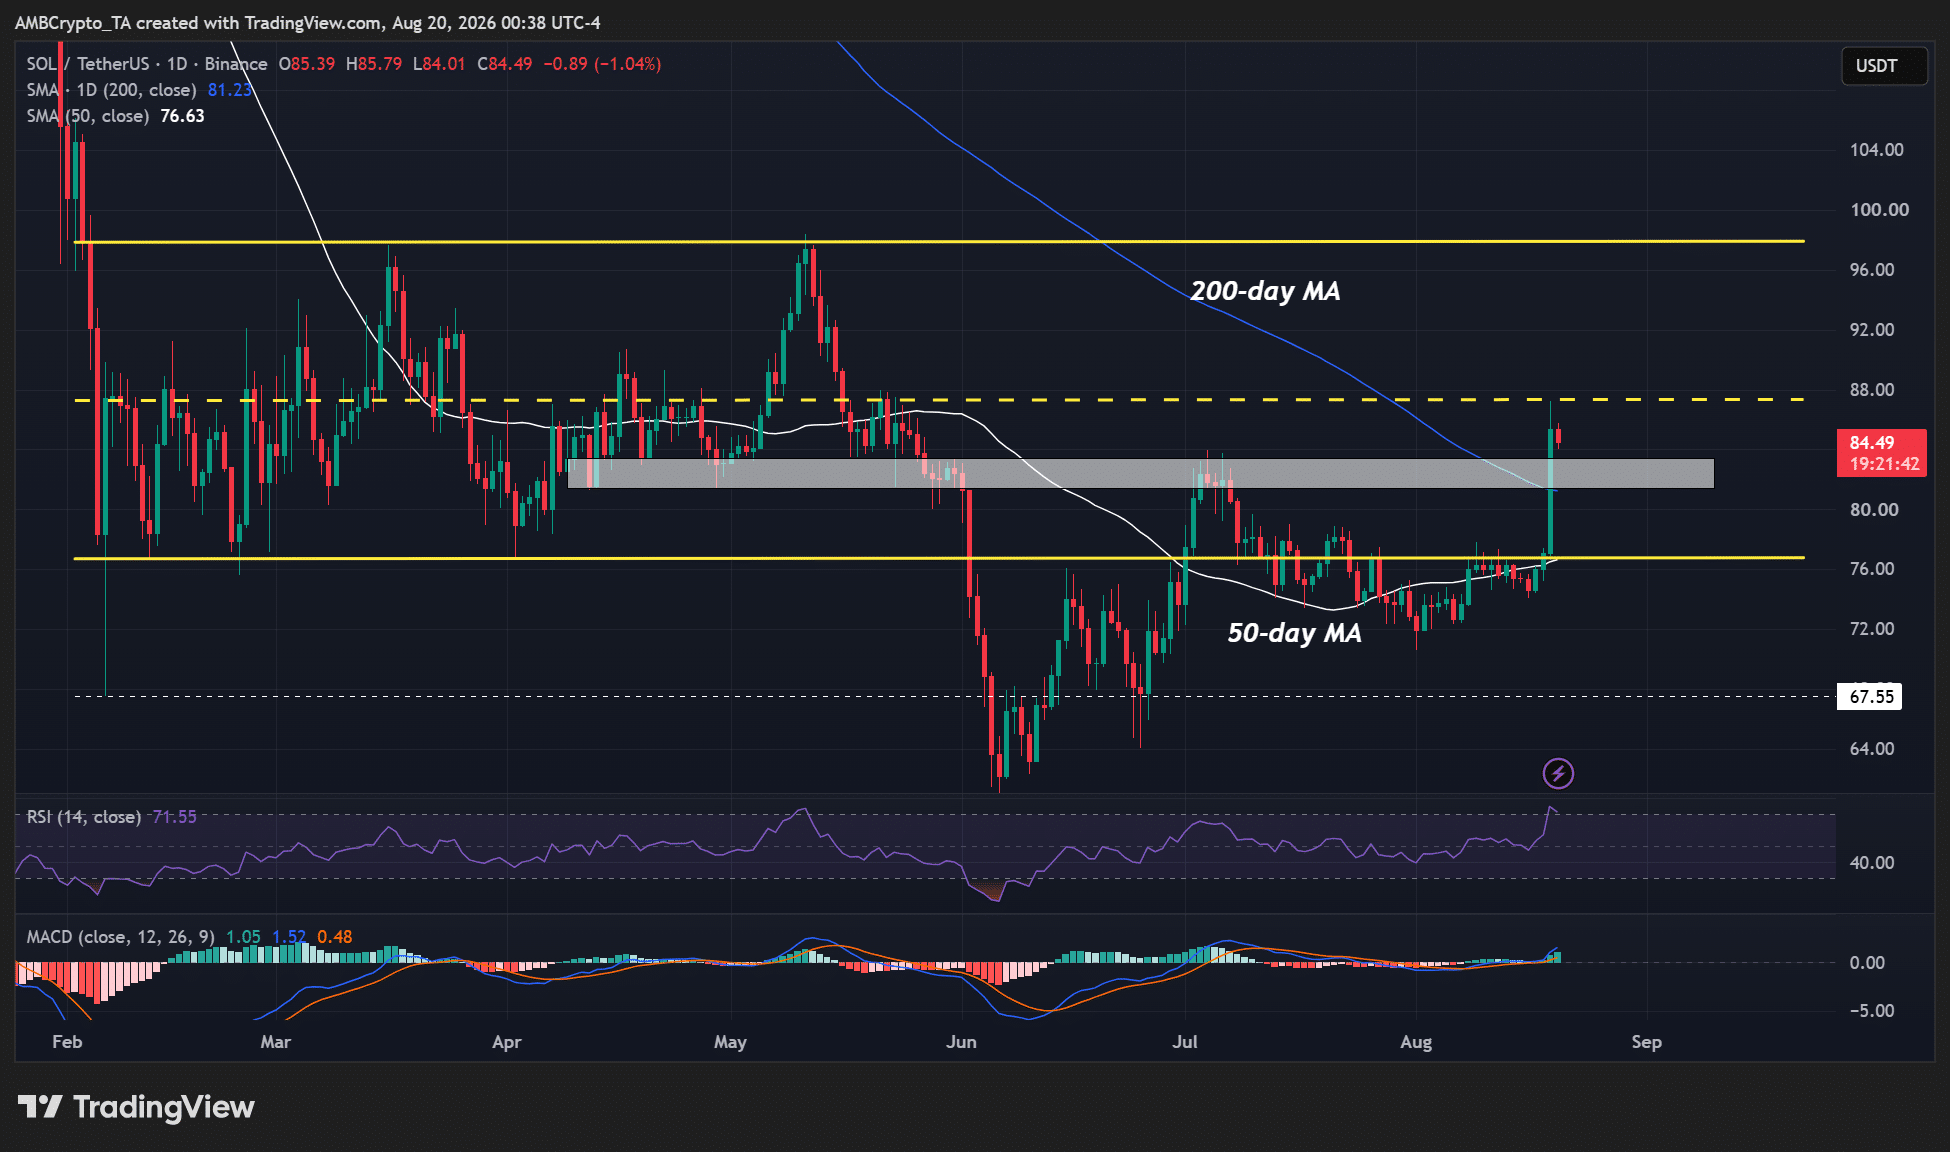
However, SOL’s Relative Strength Index (RSI) is already signaling overbought conditions. That leaves room for a short-term pullback if buyers fail to maintain momentum.
XRP Has More Technical Ground to Recover
XRP’s setup is less bullish from a trend perspective, despite its 10% jump from $1.00 to $1.10.
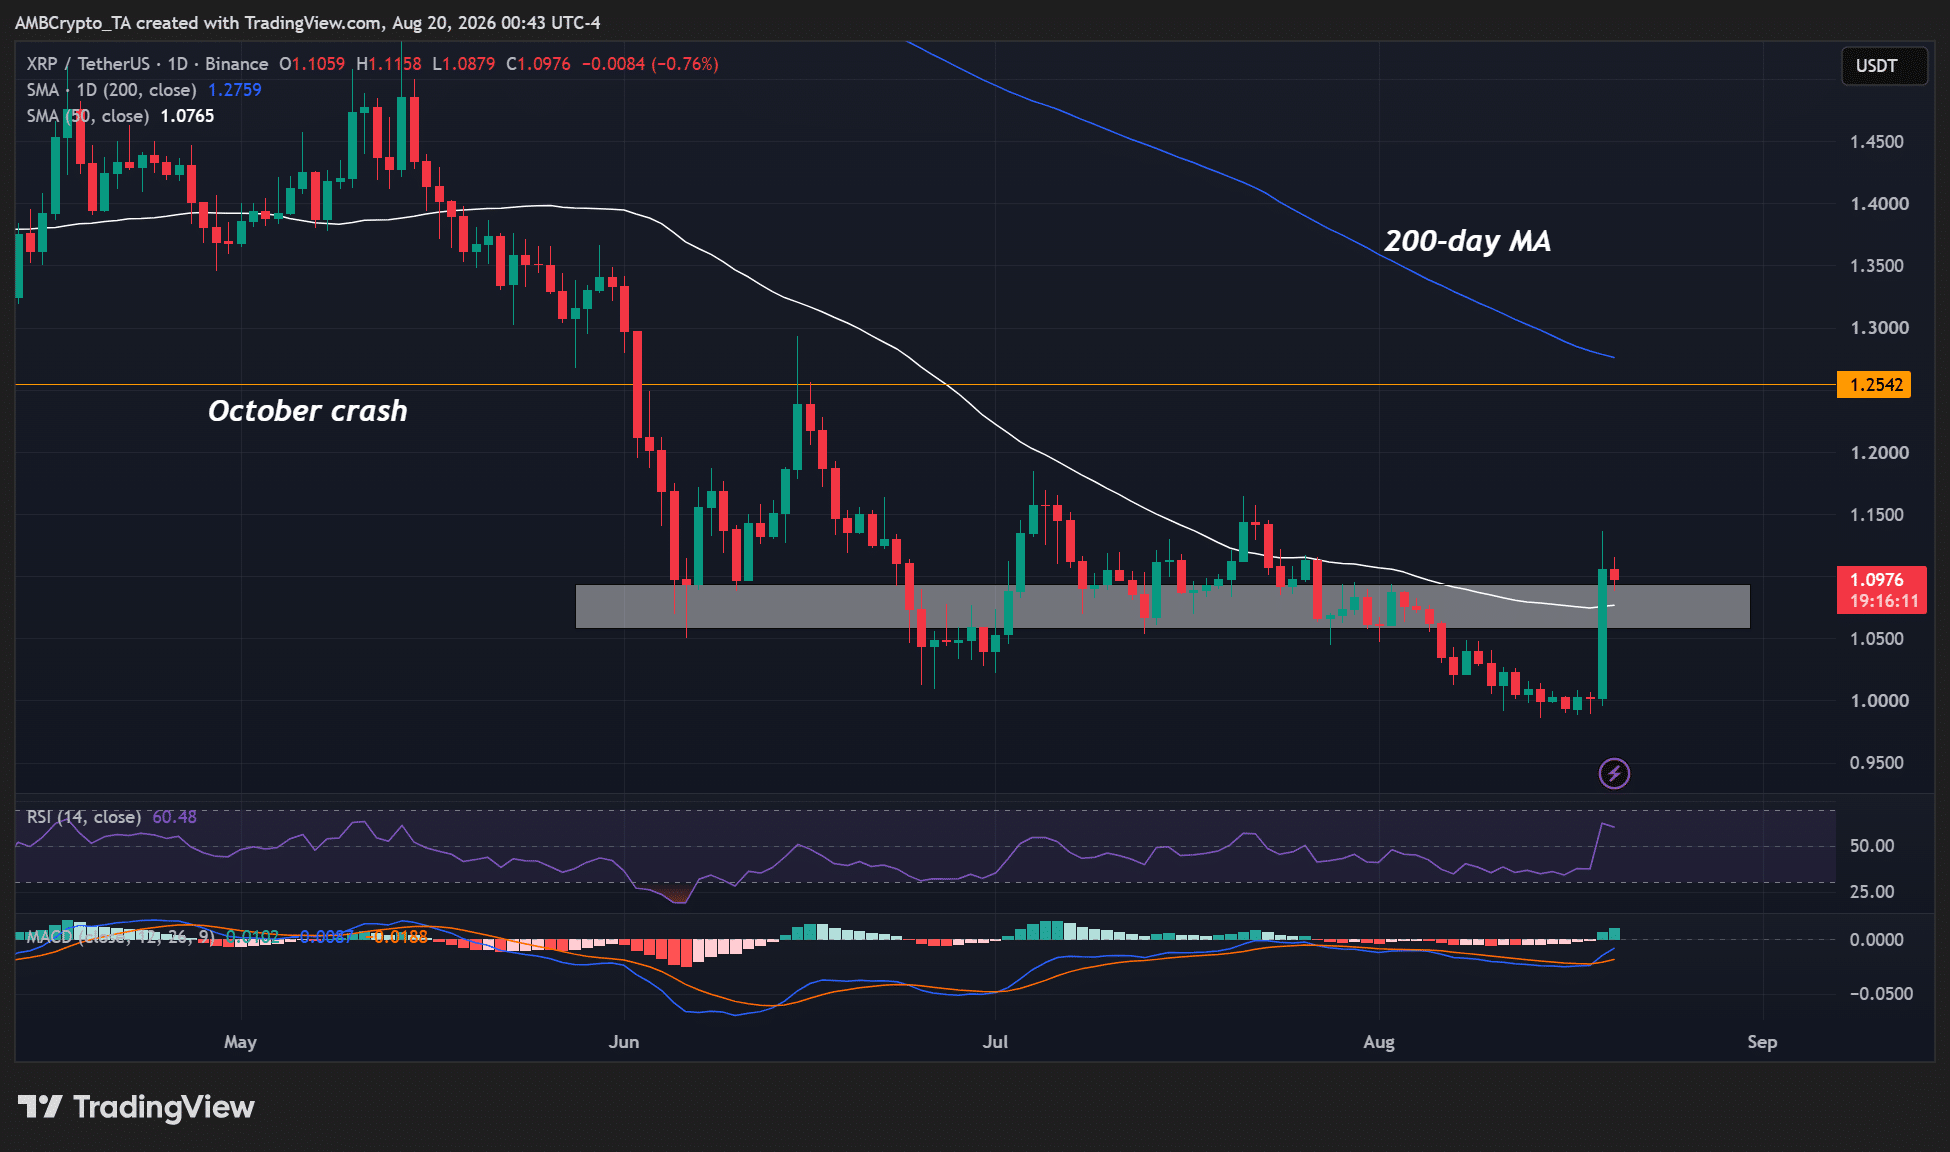
The token remains below its 200-day moving average near $1.27, meaning it has yet to reclaim a major long-term resistance level. However, unlike SOL, XRP’s RSI had not reached an overheated reading.
That leaves XRP with potentially more room to climb if buying pressure persists. A move toward the 200-day moving average would imply roughly 17.5% additional upside from the levels discussed.
The critical level is $1.00. Holding that July support zone would keep the recovery scenario intact, while a decisive breakdown could strengthen the bearish case.
Bitcoin, Liquidations and ETFs Drive Momentum
The broader rally was fueled partly by a Bitcoin short squeeze following expectations of U.S. Treasury intervention in the bond market. SOL alone saw nearly $100 million in short liquidations over 24 hours, compared with about $16.5 million for XRP.

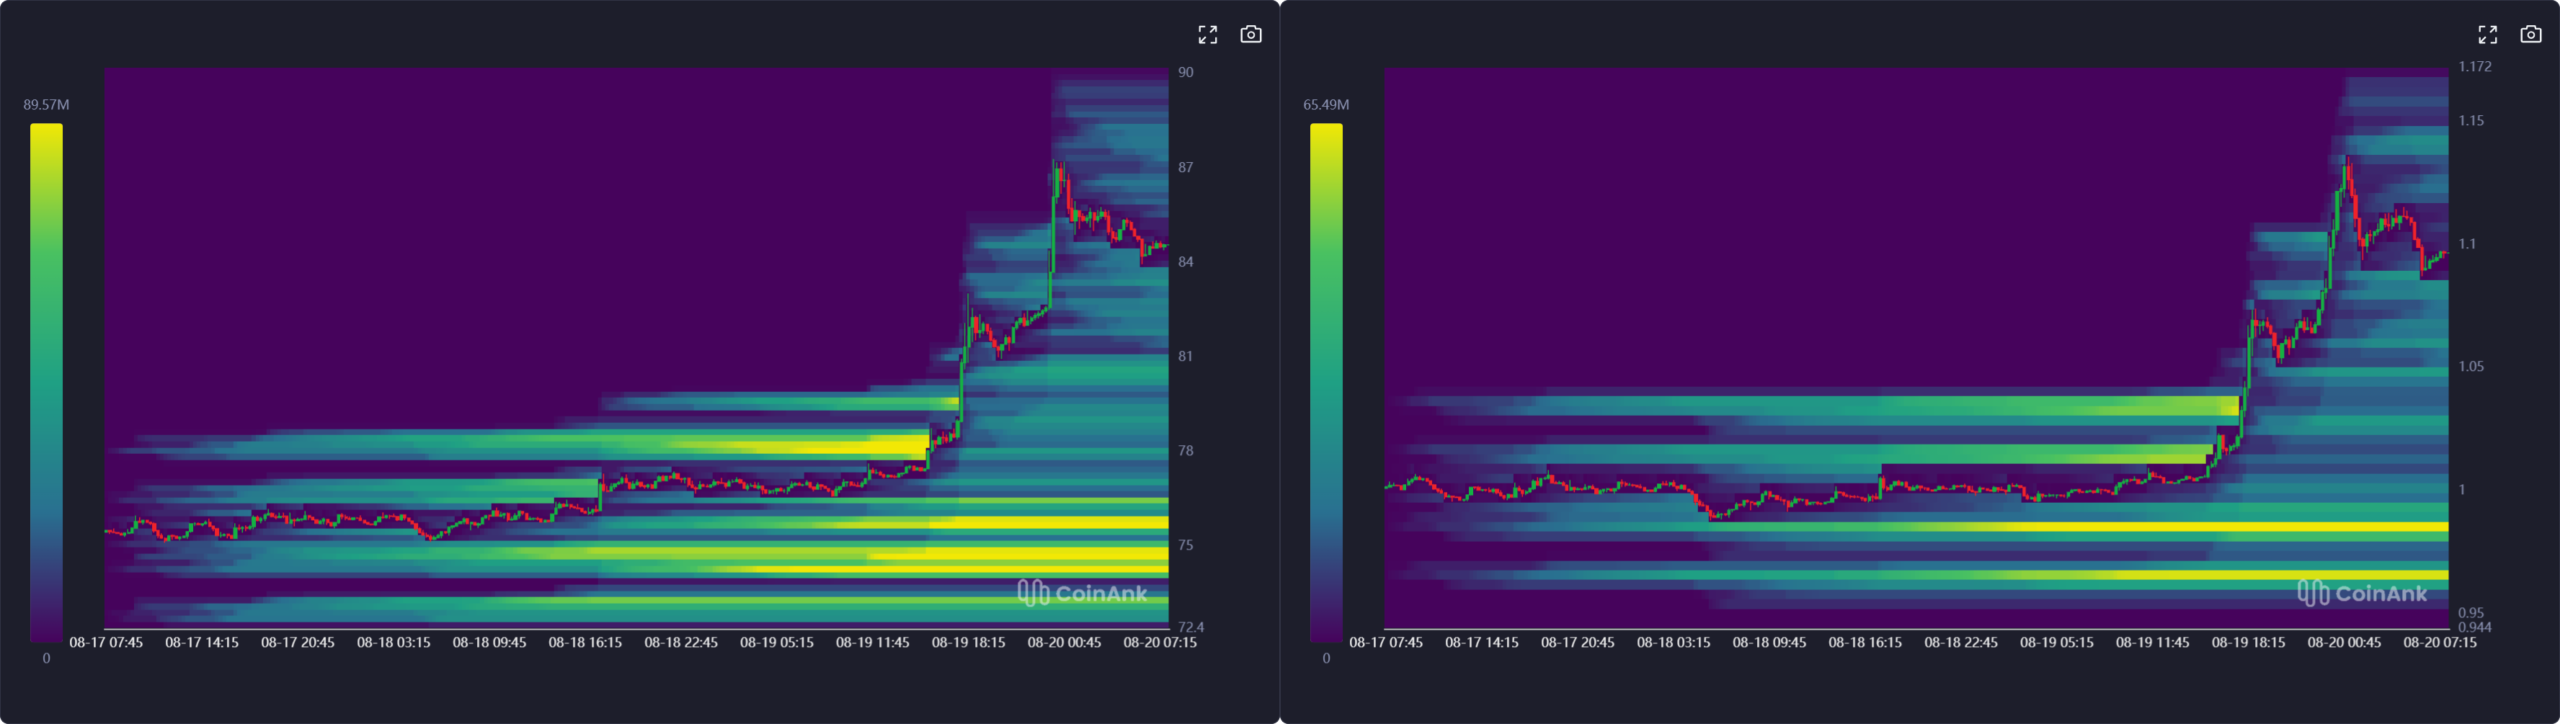
ETF flows also provided support. U.S. spot SOL and XRP ETFs recorded daily net inflows of approximately $2.1 million and $2.35 million, respectively.
The next major catalyst could be Bitcoin’s direction alongside next week’s U.S. PCE inflation data. Hotter inflation could weaken expectations for a September Federal Reserve rate cut, while softer data may encourage risk appetite.
Also Read: Bitwise Eyes Tokenized Solana ETF Shares: 5 Key Things Investors Need to Know
SOL currently has the stronger technical structure, but XRP arguably has more room to recover if it can reclaim key resistance. For both assets, however, the sustainability of the rally will likely depend on Bitcoin, liquidity and upcoming U.S. economic data.
Disclaimer: The information in this article is for general purposes only and does not constitute financial advice. The author’s views are personal and may not reflect the views of Chain Affairs. Before making any investment decisions, you should always conduct your own research. Chain Affairs is not responsible for any financial losses.


I’m a crypto enthusiast with a background in finance. I’m fascinated by the potential of crypto to disrupt traditional financial systems. I’m always on the lookout for new and innovative projects in the space. I believe that crypto has the potential to create a more equitable and inclusive financial system.