|
Getting your Trinity Audio player ready...
|
Pi Network (PI) has enjoyed a strong uptrend, but recent technical indicators suggest that bullish momentum is fading. The Directional Movement Index (DMI) and Relative Strength Index (RSI) reveal that buying pressure is waning, while the potential for a trend reversal is growing.
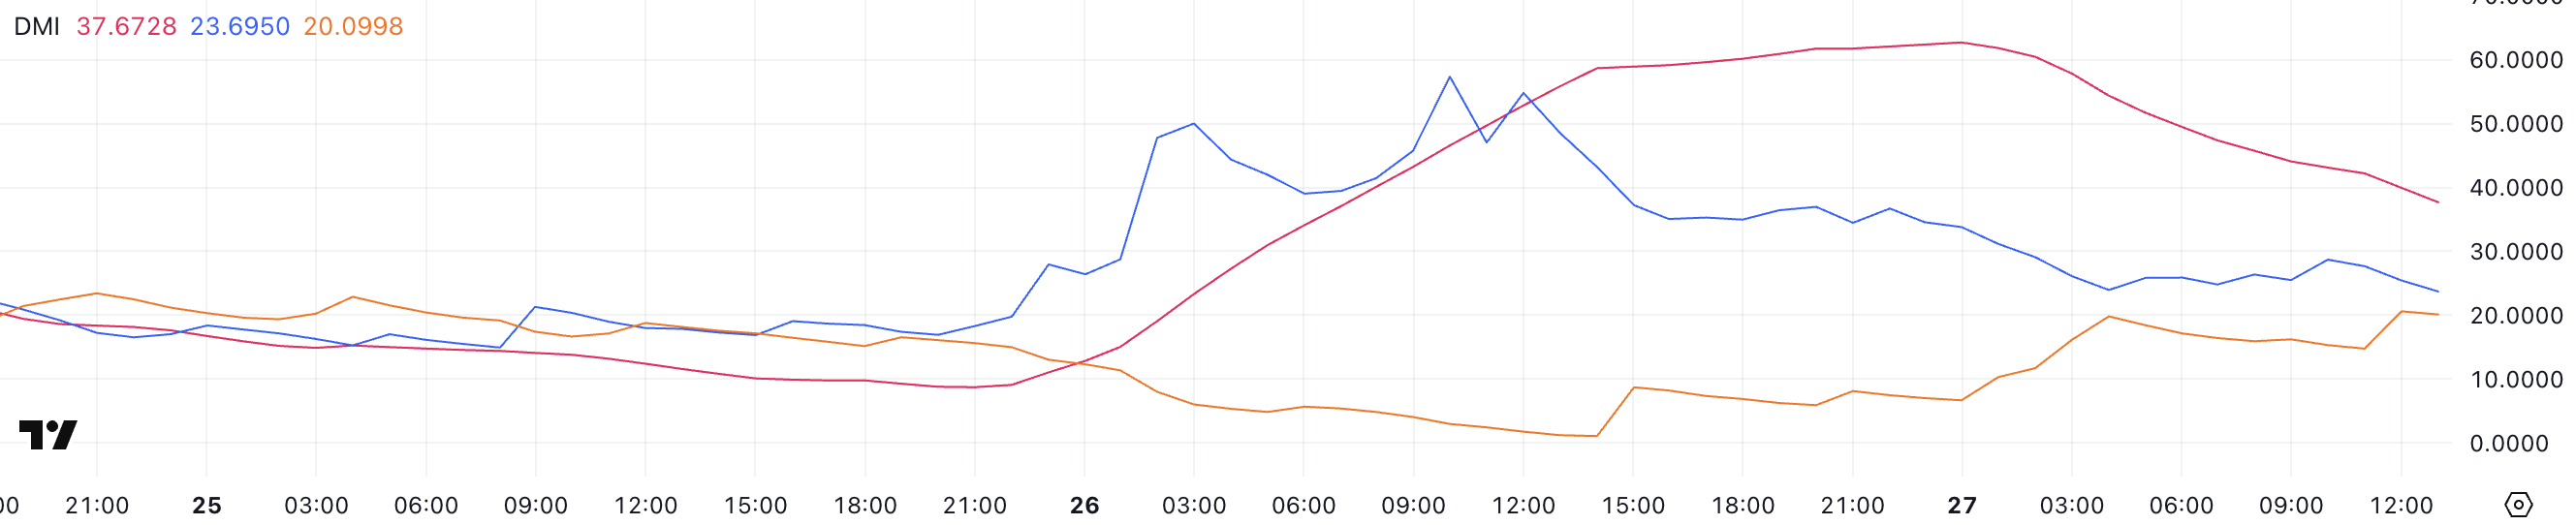
DMI Shows Buyers Still in Control—For Now
PI’s DMI highlights that buyers are still leading, but their dominance is weakening. The Average Directional Index (ADX) surged from 9 to 62.7 within a day before cooling to 37.6, indicating a strong trend that is now losing steam.
Meanwhile, the +DI has declined sharply from 57 to 23.6, signaling a drop in bullish pressure, while the -DI has climbed from 1 to 20, reflecting growing bearish sentiment. Although the +DI remains above the -DI, the narrowing gap suggests that the bullish momentum is at risk. If the -DI crosses above the +DI, it could confirm a trend reversal.
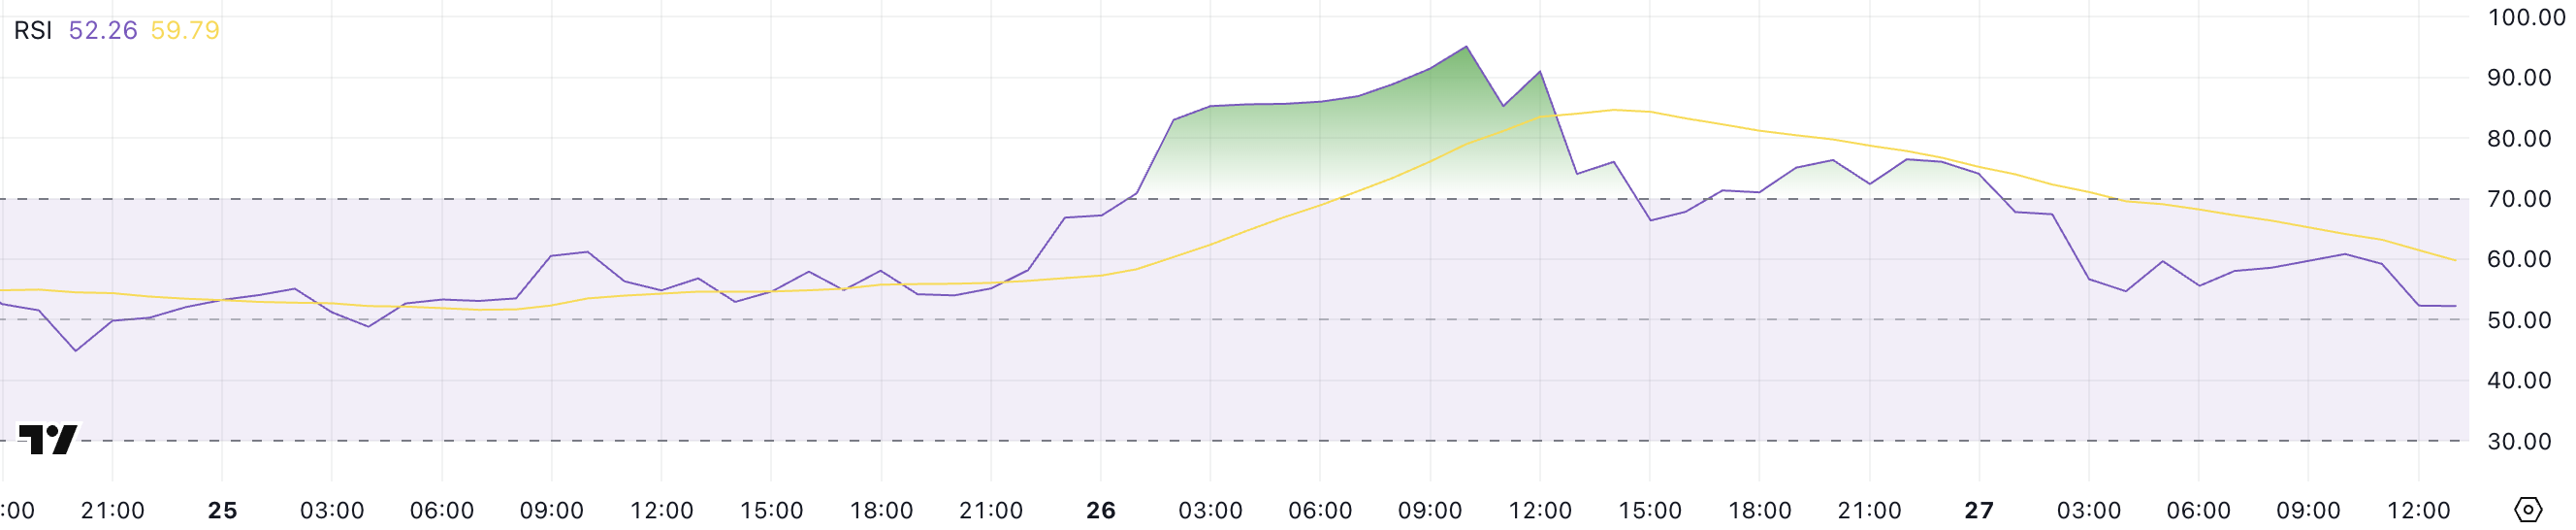
RSI Cools Off From Overbought Levels
Pi Network’s RSI has significantly cooled down after hitting an extreme overbought level of 95. Currently, the RSI sits at 52.2, placing it in neutral territory. This drop suggests that intense buying pressure has subsided, likely due to profit-taking.
An RSI between 30 and 70 does not indicate a strong bias, but the sharp decline from extreme overbought levels raises concerns. If selling pressure continues to increase, PI may face further downside.
EMA Lines Hint at Potential Correction
PI’s exponential moving averages (EMA) remain bullish, with shorter-term EMAs still above longer-term ones. However, if these lines begin to converge, it could confirm a weakening uptrend.
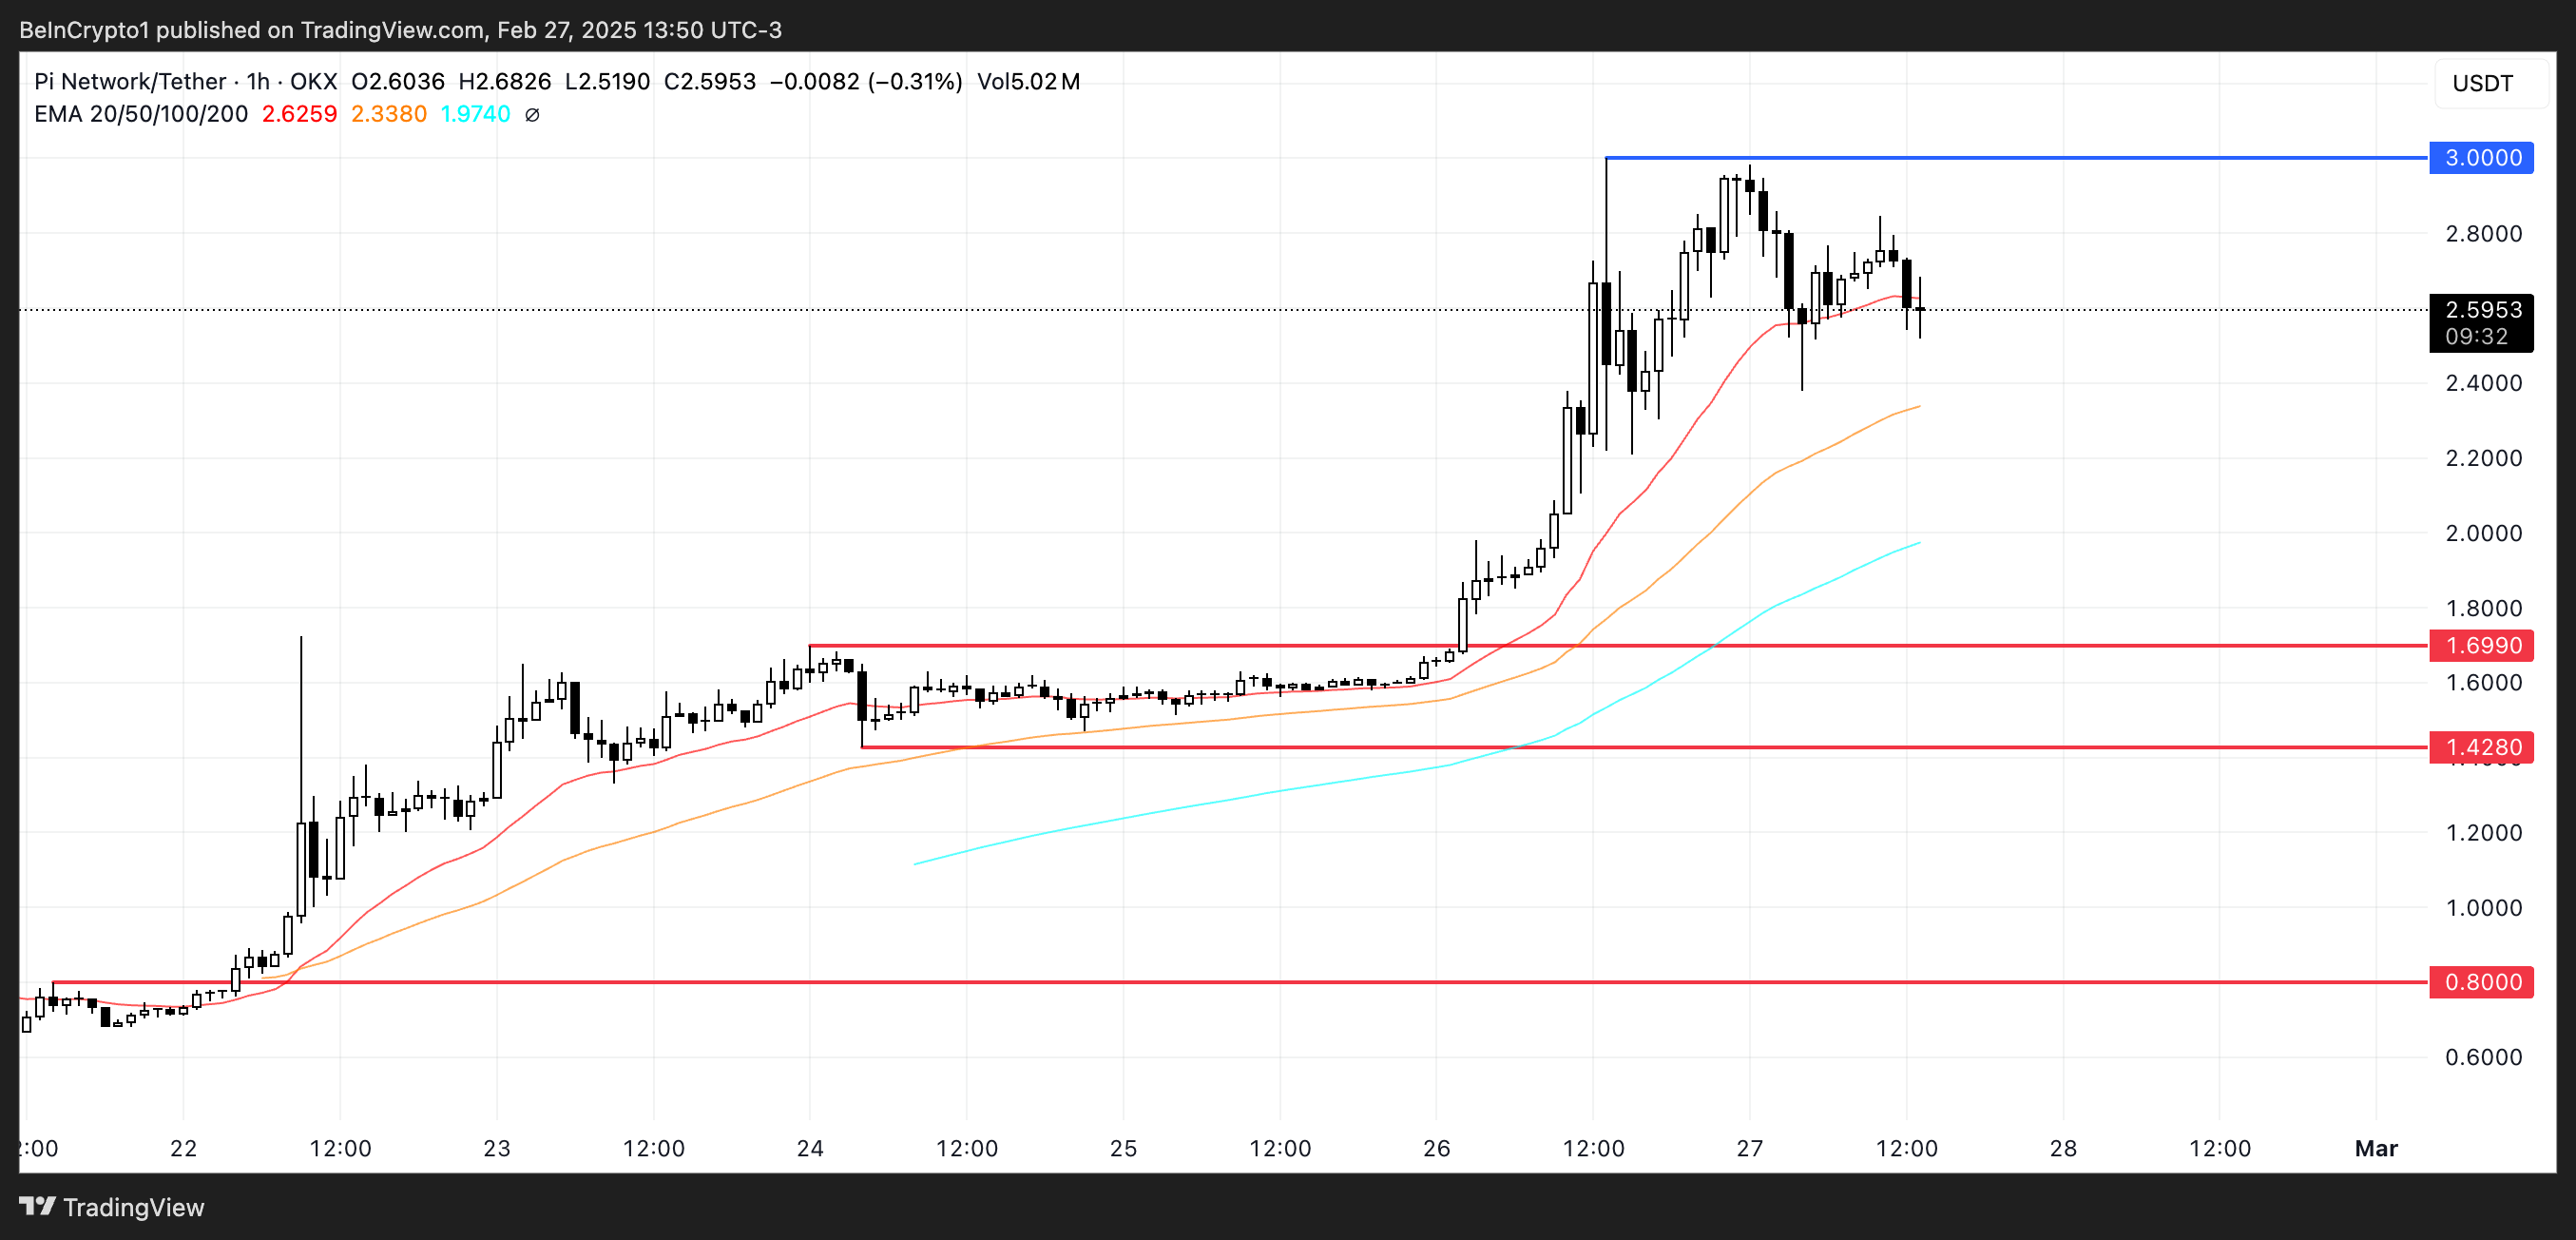
If PI can sustain its uptrend, it may aim for resistance at $3 and possibly $3.5. However, if a bearish reversal occurs, support at $1.69 will be critical. Losing this level could trigger a steep decline to $1.42 or even $0.80—a potential 68% correction.
Also Read: Pi Network Soars 54.4% to New ATH of $3 – Can It Hit $4 or Is a Correction Ahead?
As market sentiment shifts, traders should watch key support and resistance levels closely. Whether PI resumes its rally or undergoes a deeper correction depends on upcoming price action and investor response.
Disclaimer: The information in this article is for general purposes only and does not constitute financial advice. The author’s views are personal and may not reflect the views of Chain Affairs. Before making any investment decisions, you should always conduct your own research. Chain Affairs is not responsible for any financial losses.
I’m a crypto enthusiast with a background in finance. I’m fascinated by the potential of crypto to disrupt traditional financial systems. I’m always on the lookout for new and innovative projects in the space. I believe that crypto has the potential to create a more equitable and inclusive financial system.