
|
Getting your Trinity Audio player ready...
|
The meme coin market is currently experiencing a sea of red as an intraday pullback sweeps through the cryptocurrency landscape. According to the latest data, the total market capitalization of the meme coin sector has decreased by 3.47%, settling at $52.05 billion. This downturn is particularly evident among the leading meme coins, with Dogecoin, Shiba Inu, and PEPE all registering significant price declines ranging from 6% to 9%.
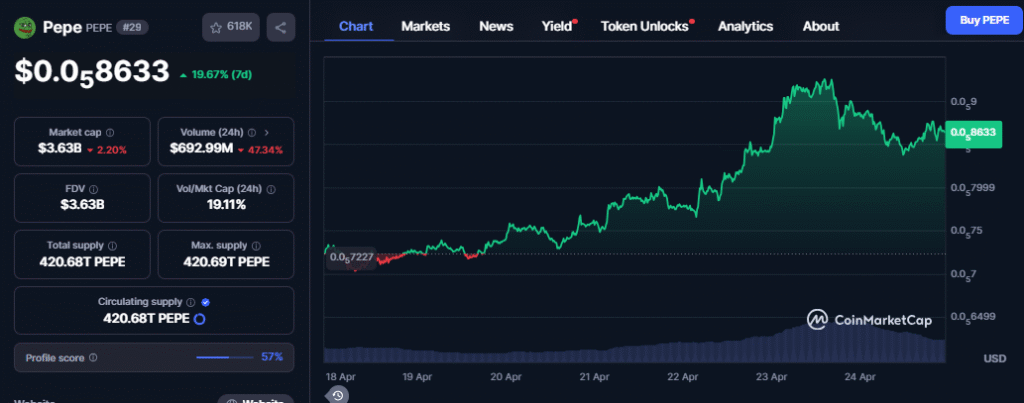
Despite the current bearish sentiment, PEPE is trading at $0.000008366, still showcasing a robust 7-day gain of nearly 14%. This resilience raises the critical question: will this short-term dip evolve into a more substantial correction, or is the popular frog-themed coin poised to overcome resistance and potentially breach the $0.000010 mark?
PEPE Price Analysis: Bullish Signals Amidst Bearish Pressure
A closer look at PEPE’s daily price chart reveals a compelling narrative of bullish attempts countered by emerging bearish pressures. The cryptocurrency had previously broken out of a falling wedge pattern, triggering a notable upward trajectory. Following a successful retest, PEPE’s recovery surged past the 50-day Exponential Moving Average (EMA) at $0.000007872. Notably, on April 22nd, PEPE witnessed a near 14% jump, forming a bullish engulfing candle.

However, this upward momentum encountered resistance at the 100-day EMA, positioned at $0.000009360. Subsequently, a bearish reversal from this dynamic resistance has led to a minor intraday pullback, with PEPE currently trading around $0.0000083, reflecting an approximate 5% decrease. This price action has formed an evening star pattern at the dynamic resistance, hinting at the possibility of a sharper correction in the near term.
Whale Activity and Key Price Targets for PEPE
Adding to the complexity of PEPE’s price action is its struggle to maintain a position above the $0.000008832 resistance level. This level is considered the neckline of a potential double bottom pattern, and failure to hold above it could invalidate the bullish formation. Despite this, the Moving Average Convergence Divergence (MACD) and signal lines continue to indicate a positive trend, suggesting that upward momentum could still prevail. The appearance of bullish histogram bars further bolsters the potential for an extended rally.
Interestingly, amidst the recent price surge, a significant whale, potentially linked to the exchange Bitpanda, has been actively accumulating PEPE tokens. Over the past 48 hours, this wallet acquired 208 billion PEPE, valued at $1.64 million, increasing its total holdings to a substantial 553 billion PEPE, worth nearly $5 million.
Also Read: PEPE Breaks Out: Meme Coin Eyes 273% Rally
Looking ahead, Fibonacci retracement levels suggest that a successful breakout above the double bottom neckline could propel PEPE to test the 23.60% Fibonacci level at $0.00001025. Sustained momentum could then target the 50% Fibonacci level at $0.00001584.
Conversely, key support levels to watch on the downside include the 50-day EMA around $0.000007873, followed by horizontal support at $0.0000052. Investors will be closely monitoring these levels to gauge the next direction of PEPE’s price action.
Disclaimer: The information in this article is for general purposes only and does not constitute financial advice. The author’s views are personal and may not reflect the views of Chain Affairs. Before making any investment decisions, you should always conduct your own research. Chain Affairs is not responsible for any financial losses.
I’m a crypto enthusiast with a background in finance. I’m fascinated by the potential of crypto to disrupt traditional financial systems. I’m always on the lookout for new and innovative projects in the space. I believe that crypto has the potential to create a more equitable and inclusive financial system.