
|
Getting your Trinity Audio player ready...
|
The JTO token has been on a bullish trajectory, consistently forming higher highs on the daily chart. However, an intraday drop of 7.87% has raised concerns about a potential sharp pullback. Currently trading at the psychological level of $3.50, JTO is grappling with bearish signals, as evidenced by the bearish engulfing candle that dipped below the 50% Fibonacci retracement level.
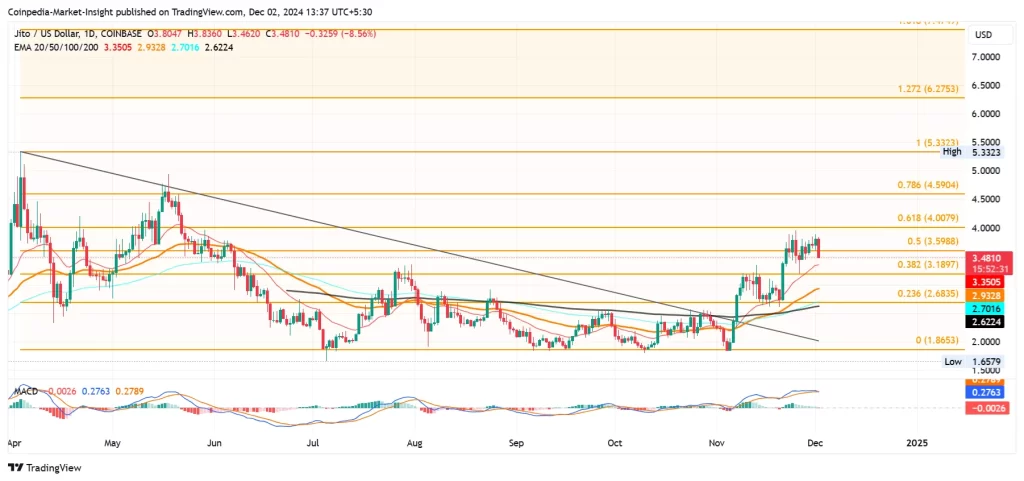
This bearish development has undercut the bullish momentum seen over the past four days, signaling a possible extension of downward pressure. The immediate support lies at $3.18, aligning with the 38.20% Fibonacci retracement level, a key area for traders watching the trendline breakout rally.
Potential Double Top Formation
Despite the overall uptrend, the JTO price faces significant resistance at $3.80, which could form a double-top reversal pattern if prices fail to rebound. The neckline for this bearish structure sits at $3.45. A daily close below this level could amplify selling pressure, potentially dragging the price toward the $3.18 support zone.
Pullbacks have historically been intense for JTO. In November, prices fell sharply from $3.18 to $2.68 within a week. If the current rejection solidifies, similar volatility could ensue.
Technical Indicators Signal Caution
- MACD: The Moving Average Convergence Divergence (MACD) indicator supports a bearish outlook, with its MACD and signal lines converging. A negative crossover could further validate the downside risk.
- EMA Levels: The 20-day EMA at $3.35 serves as immediate dynamic support, with the 50-day EMA at $2.93 offering stronger support. The 100-day EMA at $2.70 is another critical level to monitor should bearish momentum intensify.
Can JTO Break Above $3.18?
For JTO bulls, the path to recovery lies in overcoming the supply zone at $3.80. If this resistance is cleared, the price could target the $4 psychological level, with broader market recovery potentially pushing JTO to $5.33 by year-end. Conversely, a failure to hold above $3.18 could lead to a retest of the 100-day EMA at $2.70, a critical support level for the token.
The next few trading sessions will be crucial for determining JTO’s trajectory. Traders should watch for a decisive break below $3.45 or a strong rebound from key EMA levels to confirm the next move. As market conditions remain volatile, staying informed and agile is key to navigating JTO’s price movements.
Disclaimer: The information in this article is for general purposes only and does not constitute financial advice. The author’s views are personal and may not reflect the views of Chain Affairs. Before making any investment decisions, you should always conduct your own research. Chain Affairs is not responsible for any financial losses.
With a keen eye on the latest trends and developments in the crypto space, I’m dedicated to providing readers with unbiased and insightful coverage of the market. My goal is to help people understand the nuances of cryptocurrencies and make sound investment decisions. I believe that crypto has the potential to revolutionize the way we think about money and finance, and I’m excited to be a part of this unfolding story.