|
Getting your Trinity Audio player ready...
|
Hedera (HBAR), the enterprise-grade public network, is showing promising signs of bullish momentum after completing a multi-month corrective phase. Technical analysis of both daily and intraday charts suggests a potential shift in trend, although traders should remain aware of possible short-term consolidation.
Bullish Signals Emerge on Daily Chart
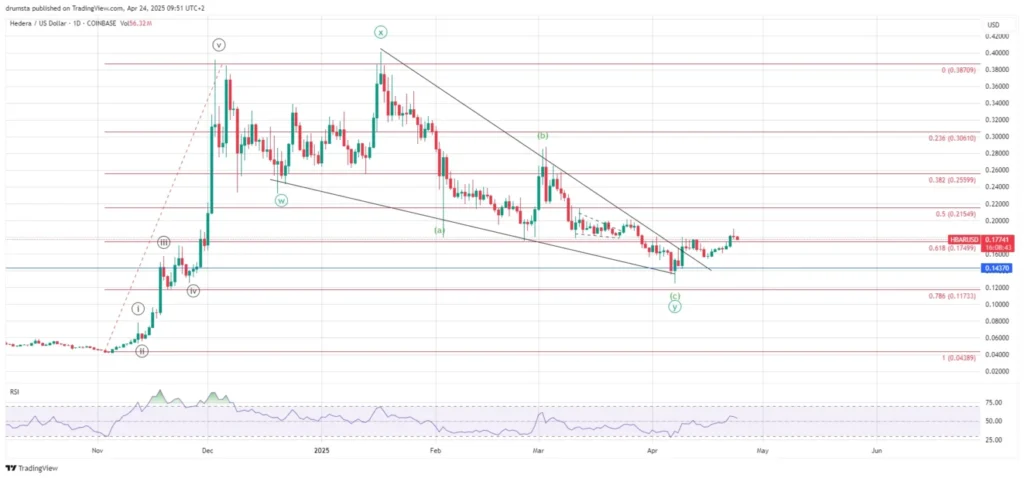
The daily chart for HBAR indicates the likely conclusion of a complex WXY correction that followed a significant drop from its $0.38 peak. This correction found support around the $0.14 mark, a level with historical significance. Notably, HBAR has recently broken out of a descending wedge pattern that formed during this corrective period, accompanied by increasing bullish momentum. This breakout has allowed the price to reclaim the 0.618 Fibonacci retracement level at $0.174, which previously acted as a support. The Relative Strength Index (RSI) on the daily timeframe is trending upwards without entering overbought territory, suggesting ample room for further price appreciation.
Intraday Chart Hints at Impulsive Move
Zooming into the 1-hour chart reveals a clear five-wave impulsive move that originated from the April 7th low. According to Elliott Wave theory, the price appears to be in the midst of this impulse, with waves (i), (ii), and (iii) already completed. The current price action suggests that wave (iv), a corrective wave, may be underway. Analysts anticipate two potential scenarios for this wave (iv) pullback: a shallow correction that finds support in the $0.172-$0.175 range before the continuation of wave (v) towards the $0.215 target, or a deeper correction that could test the $0.143 support level. While some short-term weakness is anticipated due to RSI divergence at a recent local high, the overarching bullish structure remains intact as long as HBAR holds above the $0.143 invalidation level.
Also Read: HBAR Price Prediction 2025–2031: Will Hedera Hashgraph Retest Its All-Time High?
Key Resistance Levels and Potential Targets
Looking ahead, a crucial resistance level to monitor is the 0.5 Fibonacci retracement at $0.215. This level aligns with a potential resistance zone on the higher timeframe and coincides with the projected end of the five-wave impulse on the lower timeframe. A successful break above this point could pave the way for further gains towards $0.255 (0.382 Fibonacci) and potentially $0.306 (0.236 Fibonacci).
While volume has seen a slight uptick during the recent rally, it has yet to reach levels typically associated with a full bullish reversal. Nevertheless, the breakout from the falling wedge provides a strong technical indication that the corrective phase is likely over, setting the stage for potential upward movement in the near to medium term.
Disclaimer: The information in this article is for general purposes only and does not constitute financial advice. The author’s views are personal and may not reflect the views of Chain Affairs. Before making any investment decisions, you should always conduct your own research. Chain Affairs is not responsible for any financial losses.
I’m your translator between the financial Old World and the new frontier of crypto. After a career demystifying economics and markets, I enjoy elucidating crypto – from investment risks to earth-shaking potential. Let’s explore!