|
Getting your Trinity Audio player ready...
|
After a sustained period of downward pressure, the price of Hedera (HBAR) is exhibiting indications of a potential trend reversal, sparking interest among investors and traders. A detailed technical analysis suggests that a prolonged corrective pattern on the broader timeframe may have concluded, paving the way for a possible upward trajectory.
On the 4-hour chart, HBAR’s price action reveals the completion of a clear WXY correction, culminating in a significant breakout from a descending wedge pattern. The final leg of this correction, labeled as wave (c) of Y, reached a low of $0.126 on April 7th, finding support just above the 0.786 Fibonacci retracement level of a larger bullish wave. This level is often considered a key area where buying pressure can emerge, signaling the potential end of a corrective phase.
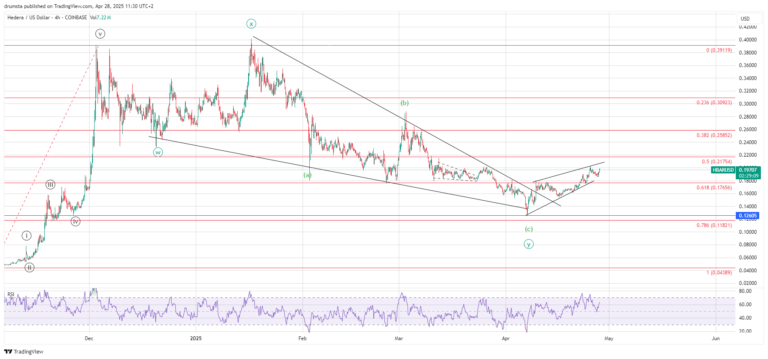
Since this low, HBAR has transitioned into a rising wedge formation. While rising wedges can sometimes resolve downwards, in this context, following a descending wedge breakout, it suggests the current upward movement could be the initial stages of a more substantial trend change. However, analysts caution that the price remains vulnerable to short-term pullbacks. A critical resistance level to watch lies around the 0.5 Fibonacci retracement at $0.217.
The Relative Strength Index (RSI) on the 4-hour chart is nearing overbought territory, hinting at a possible short-term retracement. Furthermore, a slight bearish divergence on the RSI adds weight to this possibility. Despite these cautionary signals, the preceding breakout from the descending wedge provides a degree of bullish confidence, as these patterns typically resolve with upward price action. Sustained price levels above $0.176, the 0.618 Fibonacci retracement, would likely fuel further movement towards the $0.217 resistance.
Zooming into the 1-hour chart offers a more granular perspective. HBAR completed a five-wave impulse move on April 25th, reaching $0.20, before experiencing a sharp decline to $0.185, identified as wave (a) of a corrective move. The subsequent rally appears to be wave (b) of this correction, with the price currently hovering around $0.197. Analysts anticipate that wave (b) is nearing its end, suggesting that wave (c) to the downside could soon materialize. This expected pullback is likely to target the $0.176–$0.165 range, aligning with typical corrective patterns in the early stages of a bullish trend.
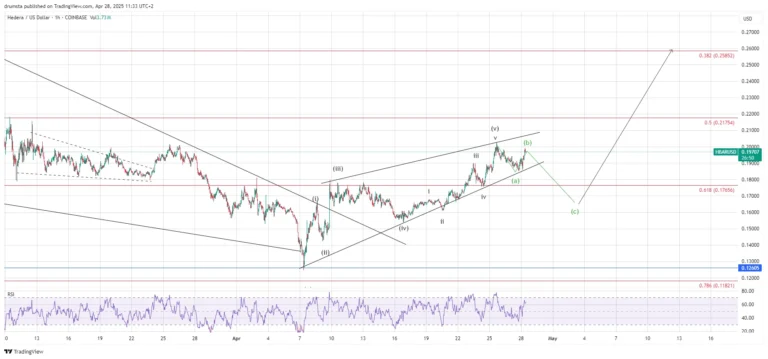
Following the completion of this anticipated (a)-(b)-(c) correction, ideally finding support above $0.17, a strong upward rally could emerge, targeting the $0.217 resistance and potentially extending towards the $0.22–$0.26 range. However, failure to maintain support above $0.176 could lead to a retest of lower levels around $0.15.
Also Read: Is Hedera (HBAR) Heading for $0.215 or a Deeper Correction? Key Price Levels to Watch
Alternatively, some analysis suggests the current price increase could still be part of the initial five-wave impulse, specifically developing its fifth wave. This scenario would be confirmed if HBAR manages to surpass its previous high.
In conclusion, while short-term volatility remains a possibility, the broader technical structure for Hedera (HBAR) points towards a potential trend reversal following a prolonged correction. Investors and traders will be closely monitoring key support and resistance levels to confirm the emergence of a sustained bullish trend.
Disclaimer: The information in this article is for general purposes only and does not constitute financial advice. The author’s views are personal and may not reflect the views of Chain Affairs. Before making any investment decisions, you should always conduct your own research. Chain Affairs is not responsible for any financial losses.
I’m your translator between the financial Old World and the new frontier of crypto. After a career demystifying economics and markets, I enjoy elucidating crypto – from investment risks to earth-shaking potential. Let’s explore!