|
Getting your Trinity Audio player ready...
|
Hedera (HBAR) has entered a corrective phase following a robust five-wave impulsive rally. However, technical indicators suggest that a local bottom has formed, potentially setting the stage for a bullish reversal.
HBAR Price Structure and Key Levels
On the 4-hour chart, HBAR recently completed an Elliott Wave five-wave impulse, followed by a corrective WXY structure. This corrective wave pushed the price from a high of $0.39 down to a recent low of approximately $0.18. Notably, the Y wave found support at the 0.618 Fibonacci retracement level, historically a strong reversal zone. A prior retest of this level on February 25 triggered a significant recovery, indicating strong buyer interest.

Additionally, HBAR’s price has broken out of a downward-sloping channel, hinting at a potential trend reversal. The Relative Strength Index (RSI) is hovering near oversold levels, reinforcing the possibility of diminishing selling pressure.
However, resistance remains strong at the 0.5 Fibonacci retracement level ($0.217), where previous attempts to break through have stalled. A successful reclaim of the $0.22 level could validate bullish momentum, targeting resistance at $0.258 (0.382 Fib retracement). Beyond this, the next supply zone lies at $0.278, aligning with prior corrective highs. Conversely, failure to reclaim these levels could see HBAR revisiting support at $0.176.
HBAR Price Prediction and Wave Count
The 1-hour chart indicates the early formation of a five-wave impulsive structure. HBAR appears to be completing wave (ii), with price action aligning with Fibonacci retracement levels.
A decisive move above $0.217 (0.5 Fib) would confirm wave (iii) development, targeting $0.23-$0.24. If wave (iii) follows Elliott Wave principles, a brief retracement (wave iv) near $0.22 could precede a final wave (v) push toward $0.258.
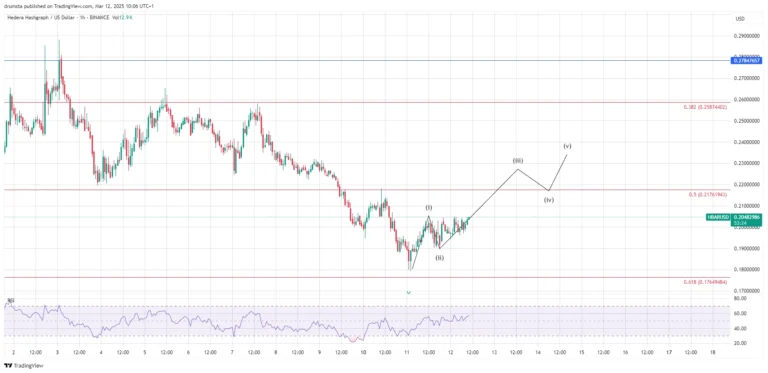
However, rejection at $0.217 would increase the likelihood of further correction. The invalidation level sits at $0.176—if breached, it signals a continuation of the previous downtrend.
Key Levels to Watch
- Immediate Resistance: $0.217 (0.5 Fibonacci retracement)
- Major Resistance: $0.258 (0.382 Fibonacci retracement)
- Key Support: $0.176 (0.618 Fibonacci retracement)
- Critical Support: $0.117 (0.786 Fibonacci retracement)
- Short-Term Target: Above $0.24 if wave structure holds
- Invalidation Zone: Below $0.176, signaling downside risk
Also Read: Hedera (HBAR) Soars 20% on ETF News, But Bearish Indicators Signal Caution
Momentum indicators show room for upward movement, but volume confirmation will be key in validating the bullish scenario. If HBAR sustains higher highs, the uptrend could gain traction; otherwise, a retest of $0.18 or even $0.117 remains possible.
Disclaimer: The information in this article is for general purposes only and does not constitute financial advice. The author’s views are personal and may not reflect the views of Chain Affairs. Before making any investment decisions, you should always conduct your own research. Chain Affairs is not responsible for any financial losses.
I’m your translator between the financial Old World and the new frontier of crypto. After a career demystifying economics and markets, I enjoy elucidating crypto – from investment risks to earth-shaking potential. Let’s explore!