|
Getting your Trinity Audio player ready...
|
Key Takeaways:
- BONK’s exchange flows suggest long-term accumulation, not selling pressure.
- Technical indicators like the Elder Ray Index and Golden Crossover favor a bullish breakout.
- A breakout above $0.00002840 could propel BONK toward $0.00003670, but downside risks remain below $0.00001806.
The meme coin market is heating up again, and Solana-based BONK is at the center of renewed speculation. With the price consolidating just under major resistance, traders are watching closely for a decisive move above $0.00002840. Momentum indicators and exchange flows suggest a bullish setup, but BONK must clear key levels to confirm a sustained rally.
Exchange Flows Indicate Long-Term Accumulation
Arkham Intelligence’s netflow data shows BONK has experienced consistent negative exchange flows over the past year. This means more tokens are being withdrawn from exchanges than deposited—often interpreted as a sign of accumulation rather than impending sell-offs.
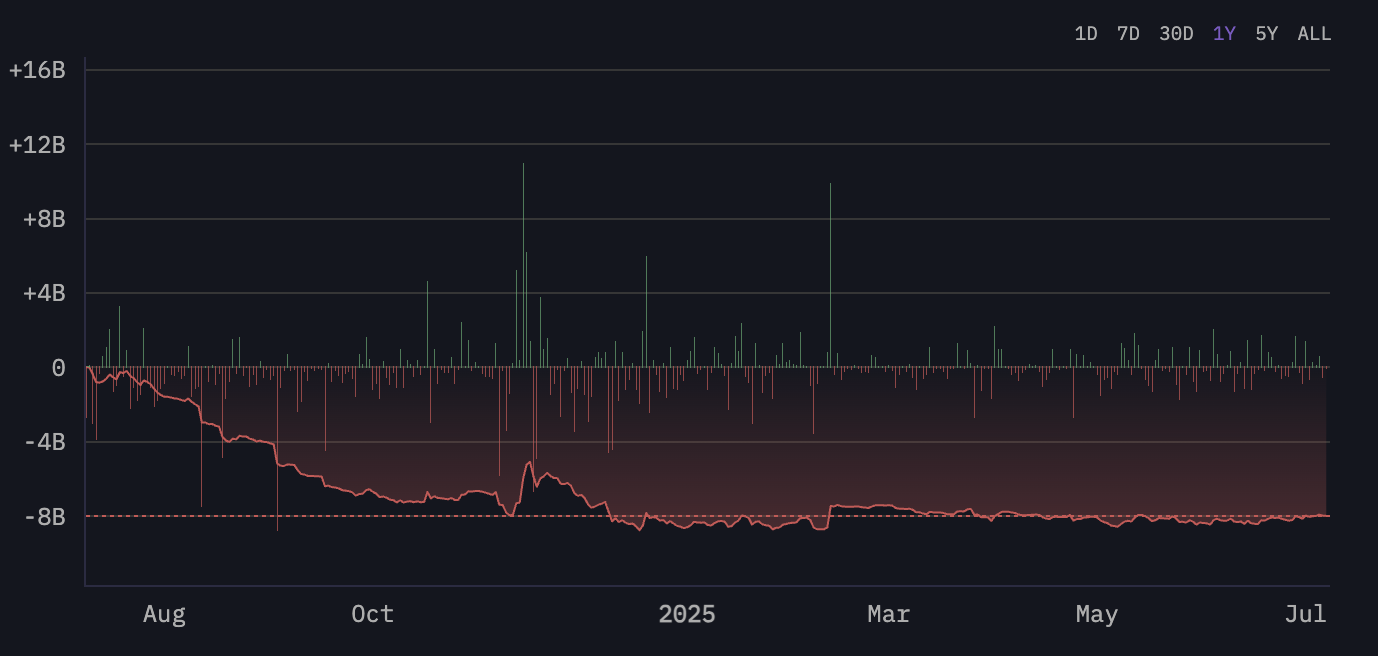
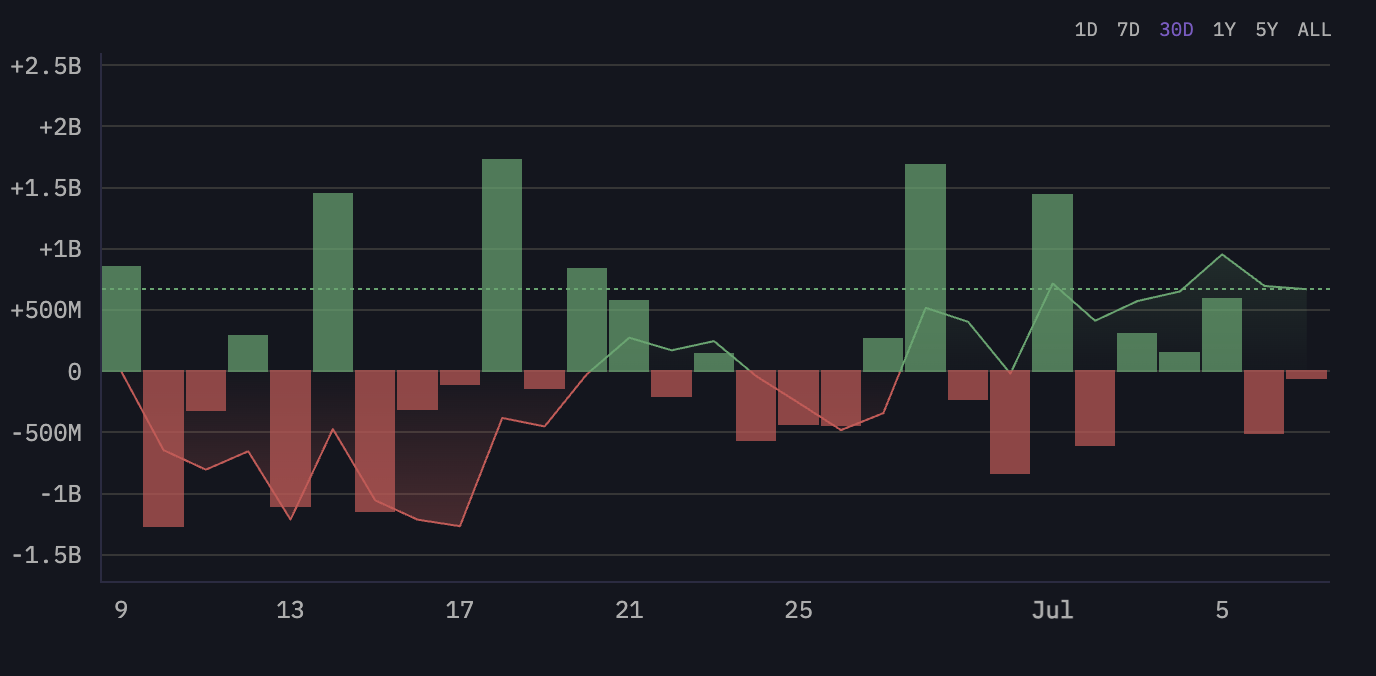
Although the past 30 days show a moderation in outflows, netflows remain negative, implying a neutral-to-bullish bias. This hints that the recent rally is not driven by panic or hype, but rather a quiet supply squeeze forming over time.
Elder Ray Index Flips Bullish as Buyers Take Charge
BONK’s Elder Ray Index has recently flipped into bullish territory. This technical indicator measures the power of buyers and sellers by comparing price action to a moving average. A positive reading suggests that bulls are regaining dominance, reinforcing the idea that BONK’s current uptrend has legs.
Combined with stable netflows and improving sentiment, this momentum indicator supports the theory that the path of least resistance could be higher.
Golden EMA Crossover Could Be the Breakout Catalyst
The BONK chart also shows an approaching Golden Crossover—the 50-day Exponential Moving Average (EMA) is nearing a cross above the 200-day EMA. Historically, this crossover is seen as a strong bullish signal, especially when supported by rising volume.
If confirmed, the breakout above the $0.00002577–$0.00002840 resistance band could open the door to upside targets around $0.00003600 or even $0.00003670. This zone lacks major resistance, giving bulls an opportunity to drive a swift price expansion.
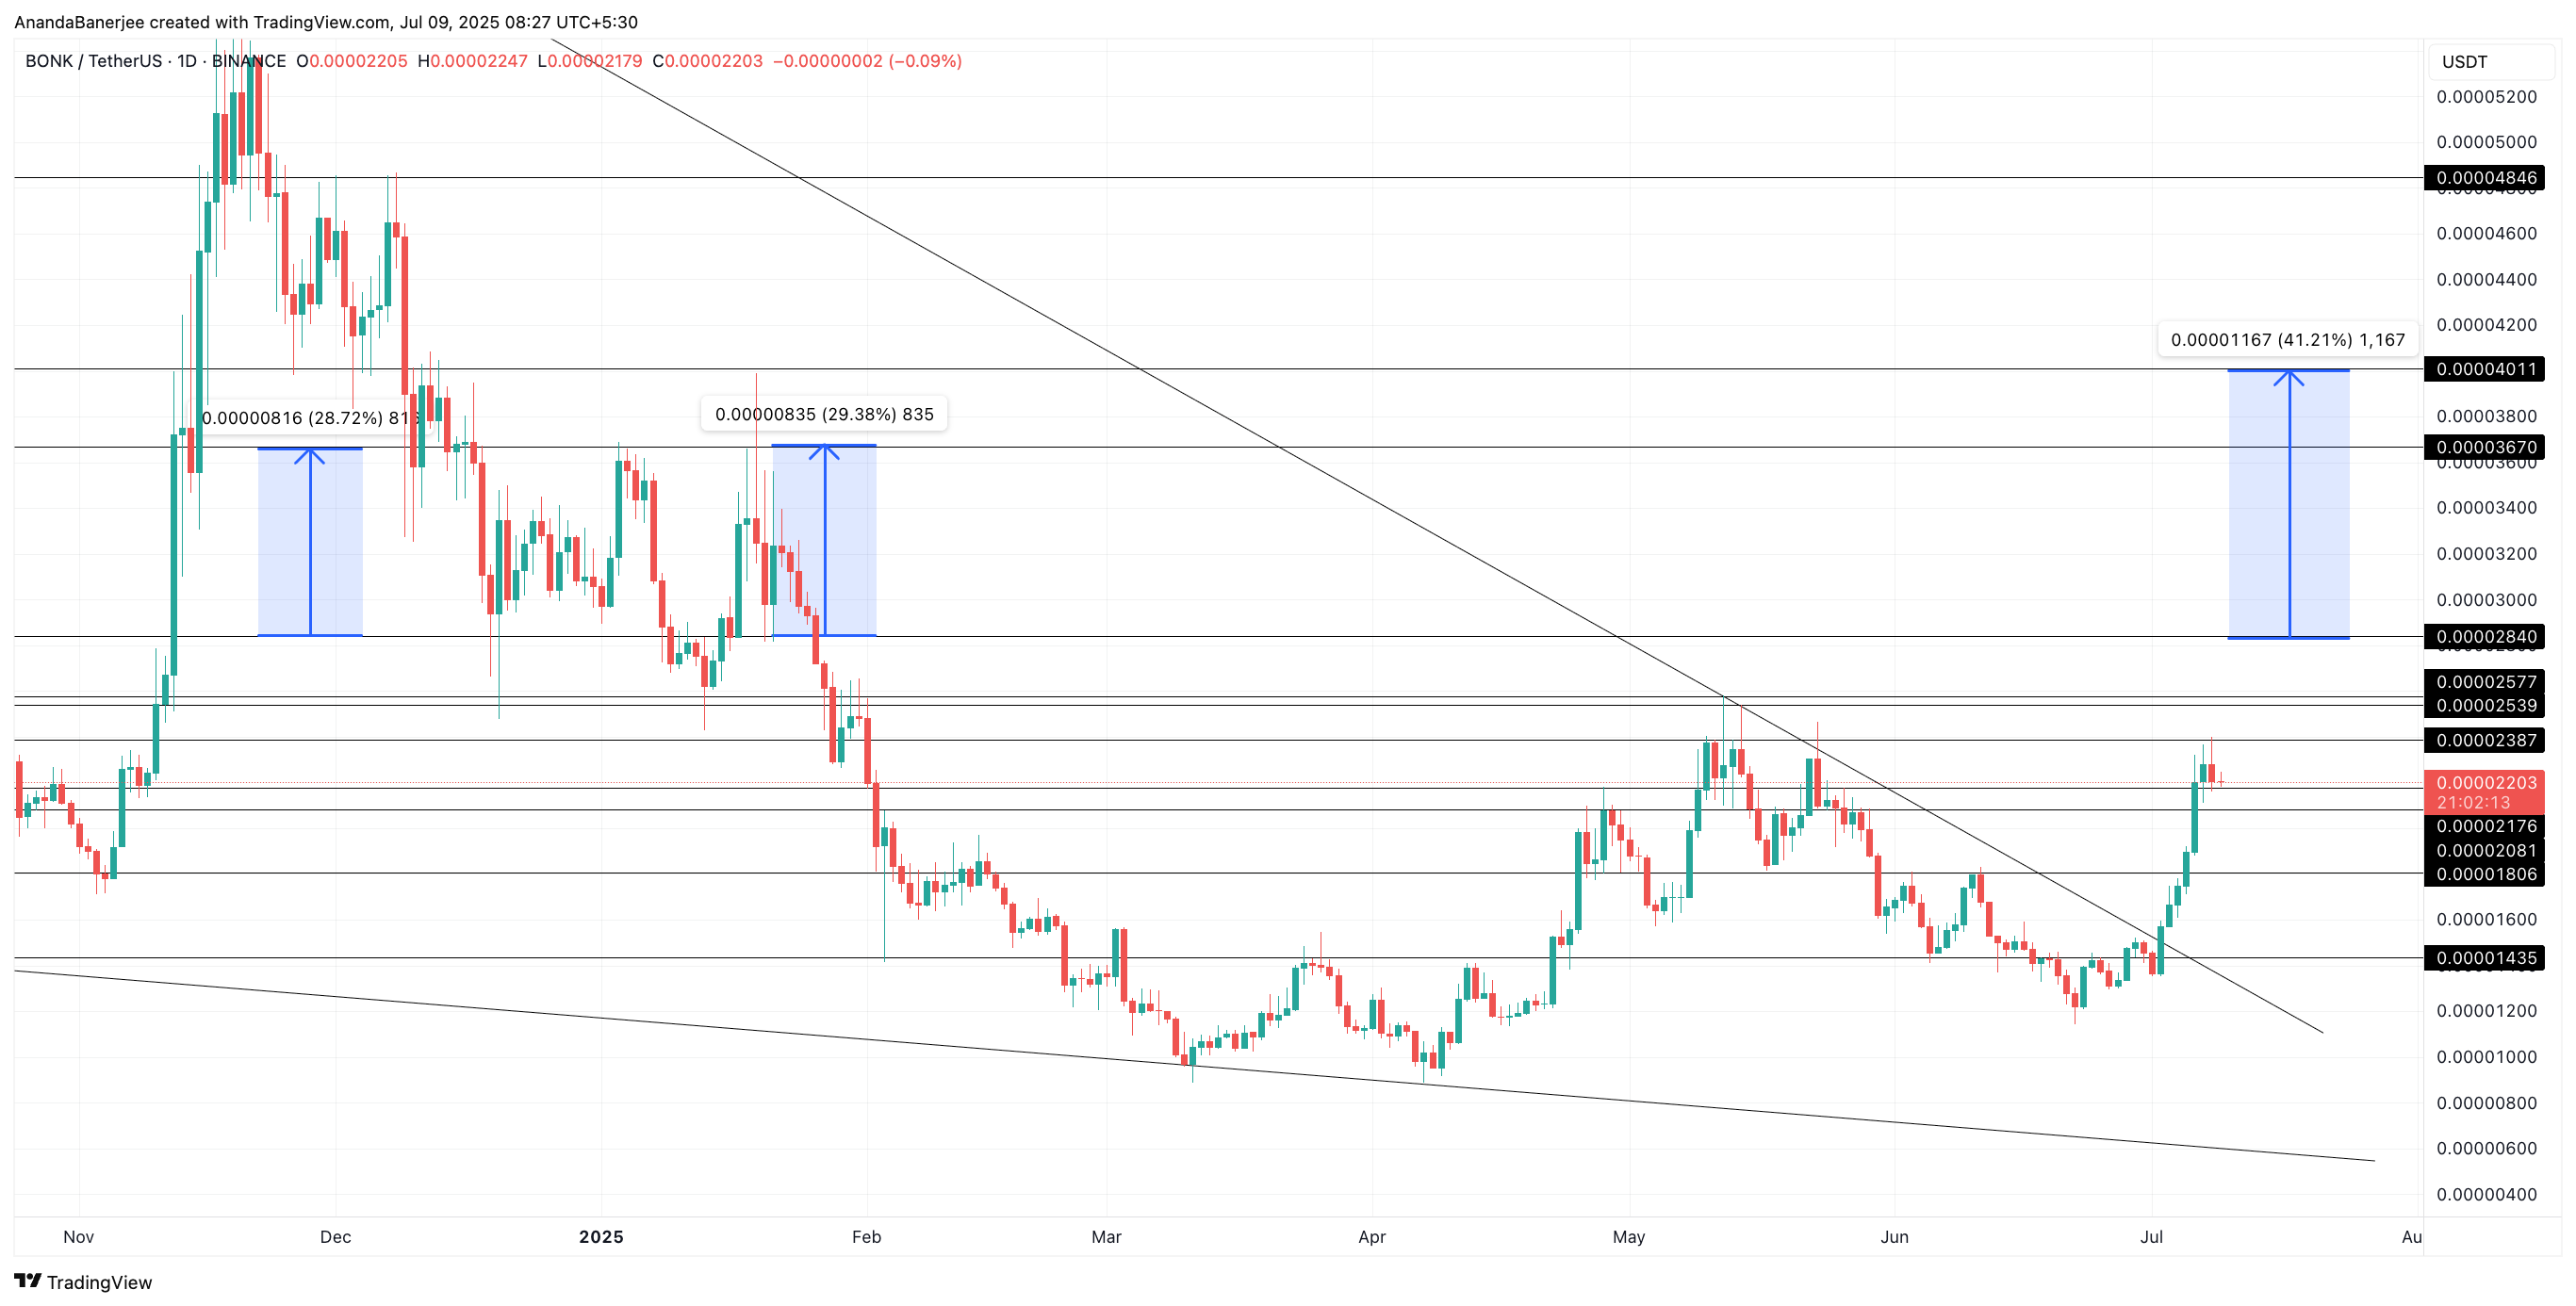
Another bullish element is BONK’s recent breakout from a year-long falling wedge, a classic reversal pattern. After months of consolidation between lower highs and stable support, BONK surged above $0.00001550, signaling renewed strength.
Also Read: Bonk.fun Flips Pump.fun: $500K Daily BONK Burns Fuel Solana Meme Coin Surge
Currently consolidating around $0.00002203, the token is testing resistance near $0.00002389. A clean breakout above this level—with volume—could trigger the next leg up.
All signs point to a bullish setup for BONK, but a clean breakout above $0.00002577–$0.00002840 is crucial to unlocking higher price targets. A failure to hold above $0.00001806 could weaken the structure, while a dip below $0.00001435 would invalidate the falling wedge breakout entirely.
Disclaimer: The information in this article is for general purposes only and does not constitute financial advice. The author’s views are personal and may not reflect the views of Chain Affairs. Before making any investment decisions, you should always conduct your own research. Chain Affairs is not responsible for any financial losses.
I’m your translator between the financial Old World and the new frontier of crypto. After a career demystifying economics and markets, I enjoy elucidating crypto – from investment risks to earth-shaking potential. Let’s explore!