
|
Getting your Trinity Audio player ready...
|
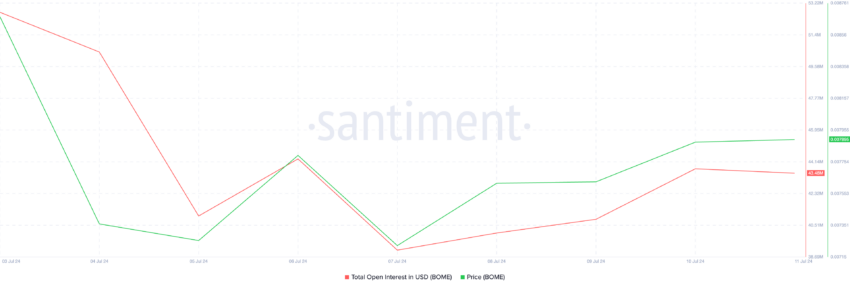
Holders of the Solana-based meme coin Book of Meme (BOME) have reason to be cautiously optimistic. After plummeting to a four-month low of $39 million on July 7th, the open interest for BOME has seen a welcome uptick of 10% in the past three days.
Open Interest As A Gauge of Trading Activity
Open interest refers to the total number of outstanding options or futures contracts for an asset that haven’t been settled yet. A rising open interest typically indicates an influx of new traders entering positions, suggesting increased market activity.
In BOME’s case, the recent surge in open interest coincides with an 8% price increase since July 7th. This suggests that traders are returning to the meme coin as its price climbs. Traditionally, rising open interest alongside a price increase is seen as a confirmation of a strengthening uptrend.
Long Liquidations: A Headscratcher?
An interesting wrinkle in BOME‘s recent rally is the prevalence of long liquidations despite the price rise. Liquidations occur when a trader’s position is forcefully closed due to insufficient funds to maintain it in a derivatives market.
Long liquidations specifically target traders who bet on an asset’s price going up (long positions). When the price falls, these traders are forced to sell their holdings at a loss to cover their margin requirements.
So, how can long liquidations occur during a price increase? Margin calls are the culprit. When trading with leverage, traders borrow funds to amplify their positions. However, they need to maintain a minimum balance in their account relative to the loan amount. Even a temporary dip in price, even during a general uptrend, can trigger a margin call, forcing them to sell some of their holdings to meet the minimum balance.
BOME Price Prediction: Bullish or Bust?
A technical indicator known as the Moving Average Convergence Divergence (MACD) offers some clues about BOME’s future trajectory. The MACD analyzes an asset’s price trends and momentum, helping identify potential buying and selling opportunities.
A bullish crossover occurs when the MACD line intersects above the signal line. This signifies a shift in momentum towards an uptrend. BOME’s MACD chart hints at a potential bullish crossover, which, if successful, could propel the price to $0.0081. However, a false signal could see the price drop to $0.0077.
BOME’s recent price surge and rising open interest paint a cautiously optimistic picture. However, the prevalence of long liquidations highlights the underlying volatility. While the MACD suggests a potential bullish crossover, investors should exercise caution and closely monitor the market before making any investment decisions.
Disclaimer: The information in this article is for general purposes only and does not constitute financial advice. The author’s views are personal and may not reflect the views of Chain Affairs. Before making any investment decisions, you should always conduct your own research. Chain Affairs is not responsible for any financial losses.
Crypto and blockchain enthusiast.