
|
Getting your Trinity Audio player ready...
|
- BNB risks a deeper correction if the $648 support level fails.
- Trading volume and derivatives data suggest growing bearish sentiment.
- ETF optimism continues to support long-term institutional interest in BNB.
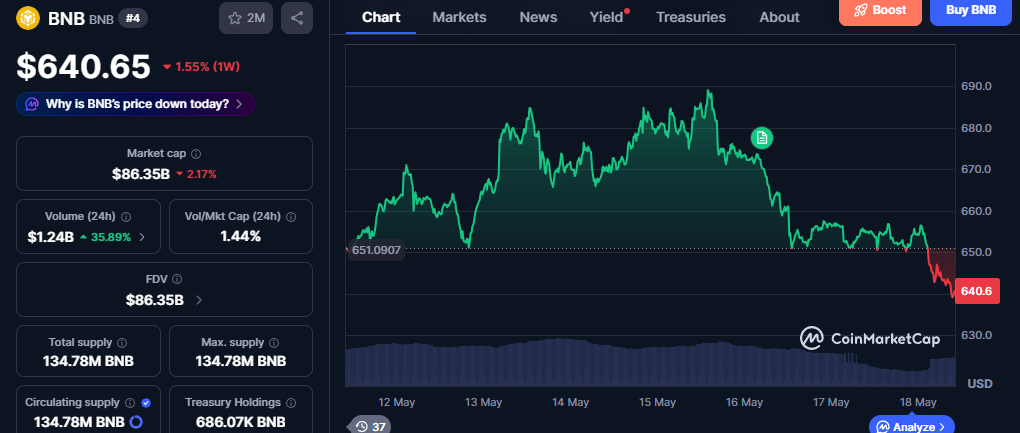
BNB is showing signs of growing weakness after struggling to break above a major resistance zone near $680. The token traded around $650 at press time, slipping more than 1% over the past 24 hours as trading activity cooled across the market.
Daily trading volume also fell sharply, dropping more than 50% to roughly $772 million. The decline in activity suggests traders are becoming increasingly cautious as BNB tests a critical technical area.

While the broader crypto market has remained relatively stable, BNB’s recent price structure points to mounting selling pressure rather than a market-wide decline.
Technical Indicators Point to Possible Breakdown
BNB’s daily chart has started flashing bearish signals near the upper edge of a long-running parallel channel that has guided price action since February 2026.
Historically, the $680 region has acted as a difficult barrier for bulls to overcome. This time appears no different. Recent candlestick formations, including an inverted hammer followed by a bearish engulfing candle, suggest sellers may once again be taking control.
Analysts are closely watching the $648 support zone. If BNB closes below that level on the daily timeframe, the token could face a deeper correction toward the $578 range — representing a potential decline of roughly 11%.
At the same time, the Average Directional Index (ADX) remains elevated above 34, indicating that the current trend still carries significant strength. For now, that momentum appears to favor bears.
Still, the bearish outlook could quickly weaken if buyers reclaim the $690 level and push price action above channel resistance.
Derivatives Traders Lean Bearish
Short-term sentiment in derivatives markets has also shifted toward caution.
Data from CoinGlass showed BNB’s Long/Short Ratio below 1, signaling that bearish positions currently outweigh bullish bets among leveraged traders. That aligns with the weakening technical structure seen on higher timeframes.
However, not all signals point downward.
Exchange flow data revealed more than $14 million worth of BNB leaving trading platforms over the last two days. Large outflows are often interpreted as accumulation, as investors move assets into private wallets instead of preparing them for sale.

ETF Optimism Keeps Long-Term Bulls Interested
Despite short-term weakness, institutional interest around BNB continues to build.
Also Read: Grayscale Advances Spot BNB ETF Filing Despite SEC Pressure on Binance
Recent filings linked to spot BNB ETF proposals from major asset managers have fueled optimism that regulatory approval odds could improve in the coming months. The development has helped support longer-term bullish sentiment even as technical indicators remain fragile.
For now, BNB appears caught between bearish short-term momentum and growing institutional optimism that could shape its longer-term trajectory.
Disclaimer: The information in this article is for general purposes only and does not constitute financial advice. The author’s views are personal and may not reflect the views of Chain Affairs. Before making any investment decisions, you should always conduct your own research. Chain Affairs is not responsible for any financial losses.
I’m your translator between the financial Old World and the new frontier of crypto. After a career demystifying economics and markets, I enjoy elucidating crypto – from investment risks to earth-shaking potential. Let’s explore!