|
Getting your Trinity Audio player ready...
|
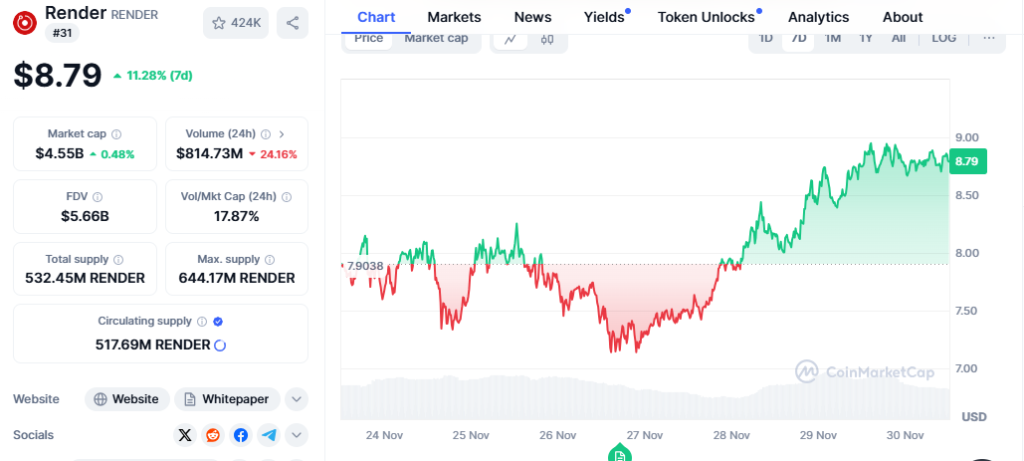
Render (RNDR), the token powering a decentralized GPU rendering network, has emerged as a top performer in the last 24 hours. As of press time, RNDR has surged over 10%, accompanied by a significant increase in daily trading volume exceeding 22%, according to CoinMarketCap.
This bullish surge signifies a potential shift in market sentiment for RNDR. The token appears to be breaking free from a bearish trend that dominated the early parts of the year. A key technical indicator, the symmetrical triangle pattern, has been breached, suggesting a breakout towards a bullish uptrend.
The bullish sentiment is further amplified by a crossover on the Moving Average Convergence Divergence (MACD) indicator. This crossover, coupled with expanding volume bars, points towards rising buying pressure behind RNDR. At the time of writing, the token is challenging the $8.87 resistance level. If the upward momentum persists, the next major hurdle lies at $13.82. This critical zone could witness price consolidation or a temporary pullback.

Analysts remain optimistic about RNDR’s potential, with some predicting a price target as high as $15 by December’s end. Should sustained buying interest and favorable market conditions prevail, longer-term targets could reach between $20 and $30.
Spot Inflow/Outflow Analysis Reveals Increased Investor Confidence
An analysis of the Spot Inflow/Outflow data provides valuable insights into investor sentiment. This data suggests that more money is flowing into RNDR compared to flowing out, indicating increased buying pressure. This could be attributed to a rise in investor confidence or speculative interest in the project.
At press time, RNDR witnessed a significant spike in net inflow, reaching $2.91 million. While this is lower than the inflow observed on November 12th, it coincides with the recent price hike to $8.869. Historically, periods of high net inflows have coincided with positive price movements, suggesting a correlation between capital influx and price appreciation. Conversely, lower or negative inflows typically align with stable or declining prices.

The recent surge in inflows suggests that Render might continue its upward trajectory. If the trend of positive net inflows persists, it further strengthens the bullish outlook for RNDR in the near future.
Large Holders Accumulate, Potentially Fueling Uptrend
Similar to the Spot Inflow/Outflow data, large holder netflow also presents intriguing details. Since late October, spikes in large holder netflow have coincided with the uptrend observed in RNDR’s price. Notably, these inflows peaked in early November, exceeding 2.49 million RNDR.

These spikes in large holder netflow seem to be closely linked to significant price hikes. During these periods, the price briefly touched and surpassed the $8.00 mark. The net inflow spikes suggest substantial buying activity or accumulation by large holders, which potentially fueled the price increase.

However, it’s important to note that these peaks have occasionally been followed by dips into negative netflow territory. This could indicate profit-taking activities or redistribution among holders. While this doesn’t necessarily negate the bullish momentum, it highlights potential short-term fluctuations.
Also Read: Bitcoin Hits $63,957 As Render Faces 17% Weekly Drop – What’s Next?
The recent netflow spikes suggest continued interest and potential buying pressure from large holders. If this trend persists, it could further bolster the current bullish momentum, potentially propelling RNDR towards higher resistance levels.
Disclaimer: The information in this article is for general purposes only and does not constitute financial advice. The author’s views are personal and may not reflect the views of Chain Affairs. Before making any investment decisions, you should always conduct your own research. Chain Affairs is not responsible for any financial losses.
I’m a crypto enthusiast with a background in finance. I’m fascinated by the potential of crypto to disrupt traditional financial systems. I’m always on the lookout for new and innovative projects in the space. I believe that crypto has the potential to create a more equitable and inclusive financial system.


