|
Getting your Trinity Audio player ready...
|
XRP, the cryptocurrency known for its pivotal role in global liquidity solutions, has entered a phase of tight consolidation. On the 1-hour chart, the digital asset is trading within a narrow range of $2.55 to $2.65, reflecting reduced volatility. Technical indicators like the Relative Strength Index (RSI), which currently sits at 75.74, point to overbought conditions. Meanwhile, the Moving Average Convergence Divergence (MACD) at 0.43886 suggests positive momentum. However, the low trading volume during this period underscores cautious market sentiment.

Short-Term Outlook
A breakout above $2.65 could trigger a bullish rally toward $2.75 or higher, while a breakdown below $2.55 might lead to a test of the $2.45 support level. The ongoing consolidation reflects uncertainty as traders await a clear directional move.

Mid-Term Analysis
The 4-hour chart provides additional insights, showing XRP’s retracement from a recent high of $2.91 to a low of $2.10, followed by a gradual recovery. Higher lows signal accumulation by buyers, particularly in the $2.30 to $2.50 range. Key oscillators, such as the Awesome Oscillator (AO) at 1.08467 and the Stochastic Oscillator at 77.99, display neutral signals, suggesting a balanced market.
A sustained move above $2.75 would validate further bullish momentum, potentially leading to a retest of the $2.90 resistance level. Conversely, a failure to hold the critical support at $2.30 could intensify selling pressure, paving the way for a dip toward $2.10 or lower.
Long-Term Dynamics
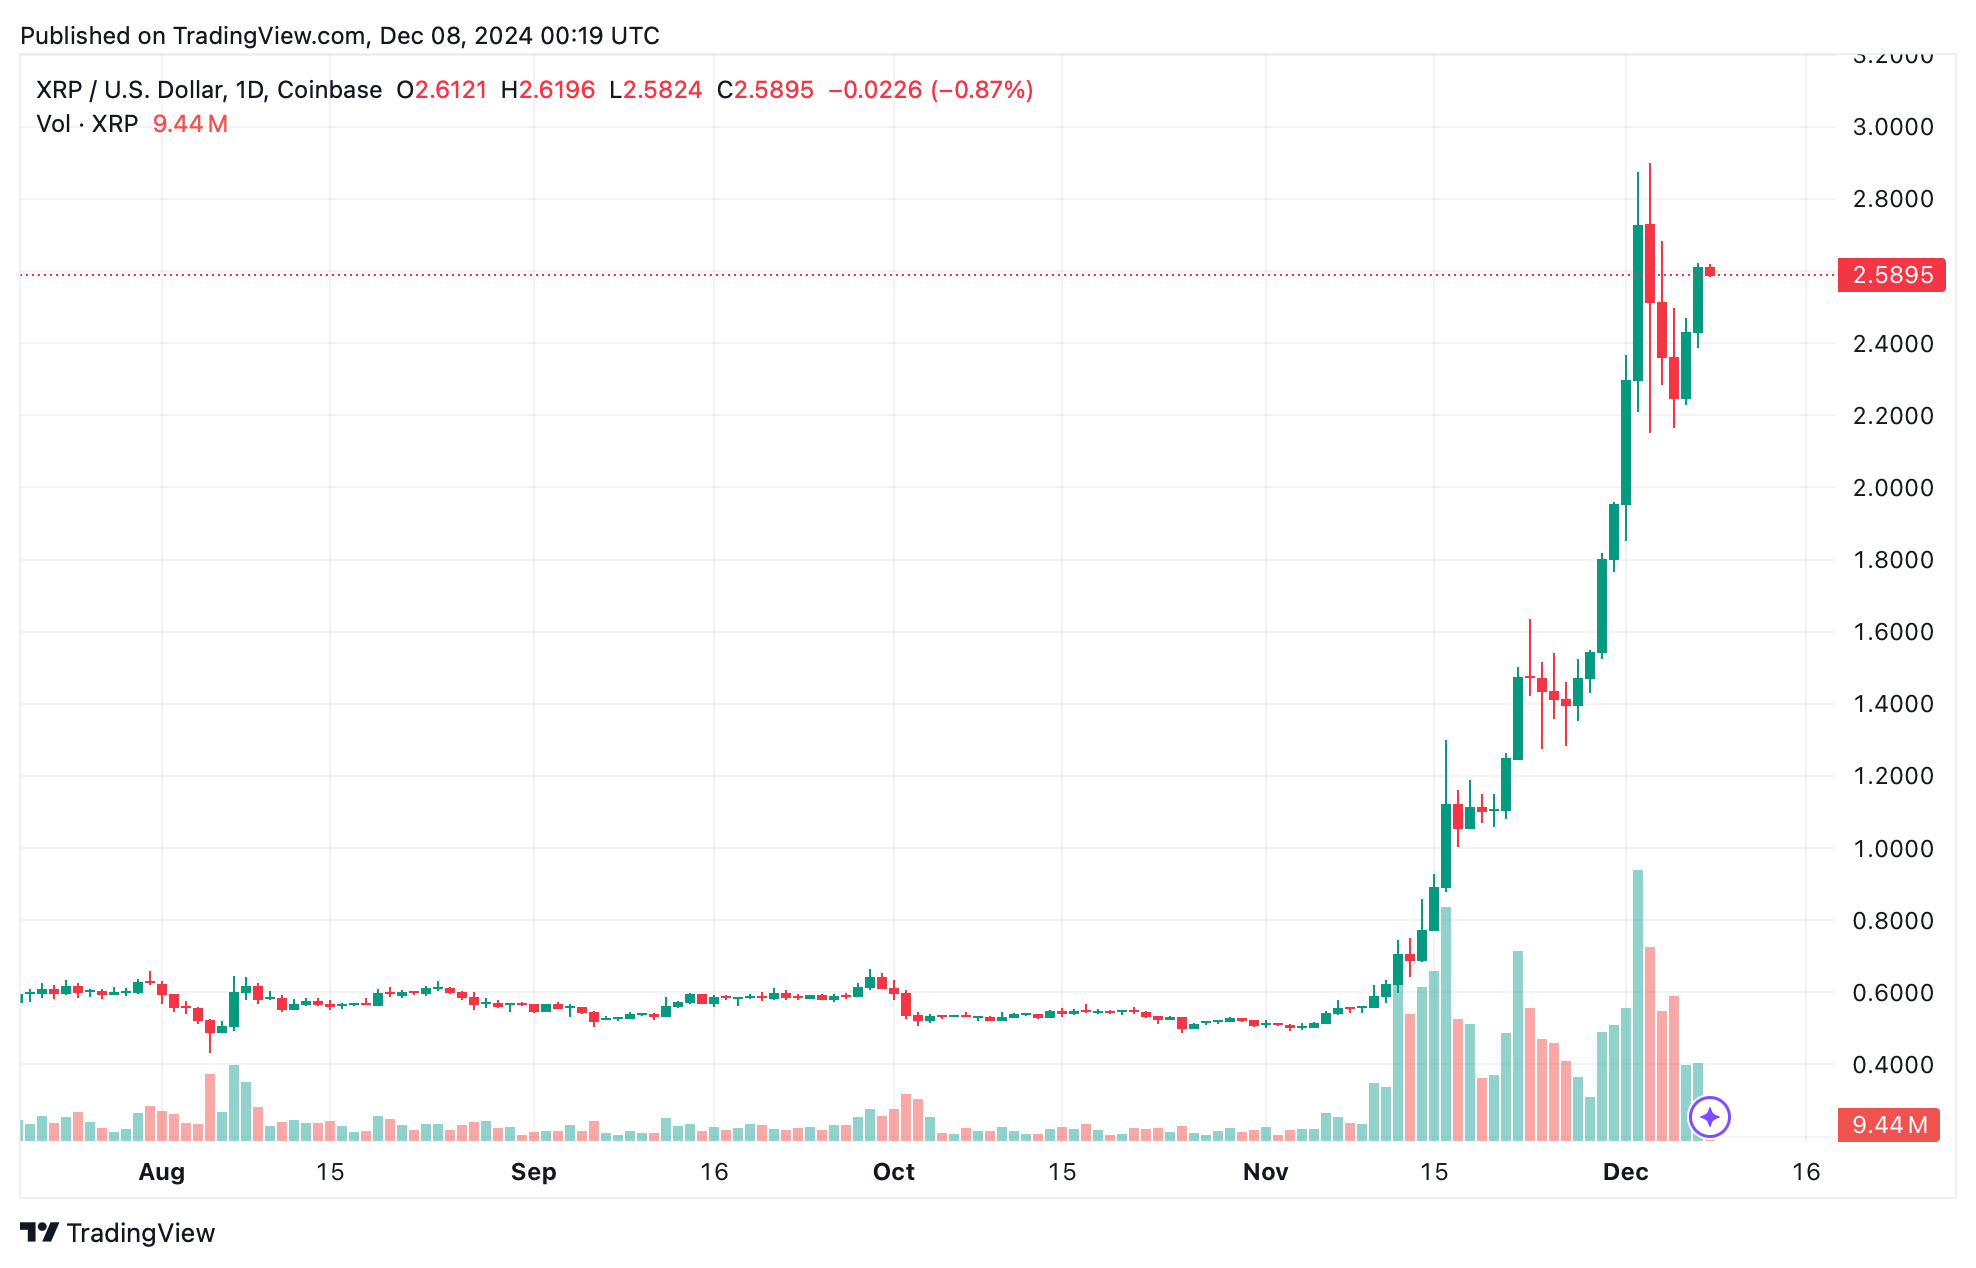
On the daily chart, XRP maintains a robust uptrend, having surged from $0.50 to a high of $2.91. Despite this remarkable rally, declining volume hints at weakening momentum. Rejection at the $2.90 resistance level further highlights potential vulnerabilities.
Long-term moving averages, such as the 200-period EMA and SMA, show strong buy signals at $0.81202 and $0.68557, respectively. Short-term moving averages also align with bullish sentiment, with the 10-period EMA at $2.29829 acting as a dynamic support level.

Bullish vs. Bearish Scenarios
- Bullish Scenario:
If XRP breaks above $2.65 and sustains momentum past $2.75, it could test $2.90 or even surpass the psychological barrier of $3.00. Steady higher lows across multiple timeframes bolster medium to long-term bullish potential. - Bearish Scenario:
Failure to maintain support at $2.30 could lead to a sharper decline. Overbought RSI readings and selling pressure from momentum indicators increase the likelihood of a retracement to $2.10, or in a more pessimistic scenario, $1.90.
XRP remains a focal point for traders, with its consolidation and mixed technical signals hinting at a decisive move. While the medium to long-term outlook leans bullish, caution is warranted due to overbought conditions and declining volume. All eyes are on the $2.65 breakout level as the market gears up for its next significant move.
This blend of cautious optimism and potential downside risk makes XRP a compelling asset to monitor in the coming days.
Disclaimer: The information in this article is for general purposes only and does not constitute financial advice. The author’s views are personal and may not reflect the views of Chain Affairs. Before making any investment decisions, you should always conduct your own research. Chain Affairs is not responsible for any financial losses.
I’m your translator between the financial Old World and the new frontier of crypto. After a career demystifying economics and markets, I enjoy elucidating crypto – from investment risks to earth-shaking potential. Let’s explore!


