|
Getting your Trinity Audio player ready...
|
Since early August, Sui (SUI) has demonstrated robust bullish momentum, with consistent upward movement on the daily timeframe. Despite periodic pullbacks, such as the dip in late October, these corrections have been relatively shallow, reinforcing the bullish sentiment. However, short-term volatility suggests traders should proceed cautiously in the days ahead.
Market Structure Remains Bullish

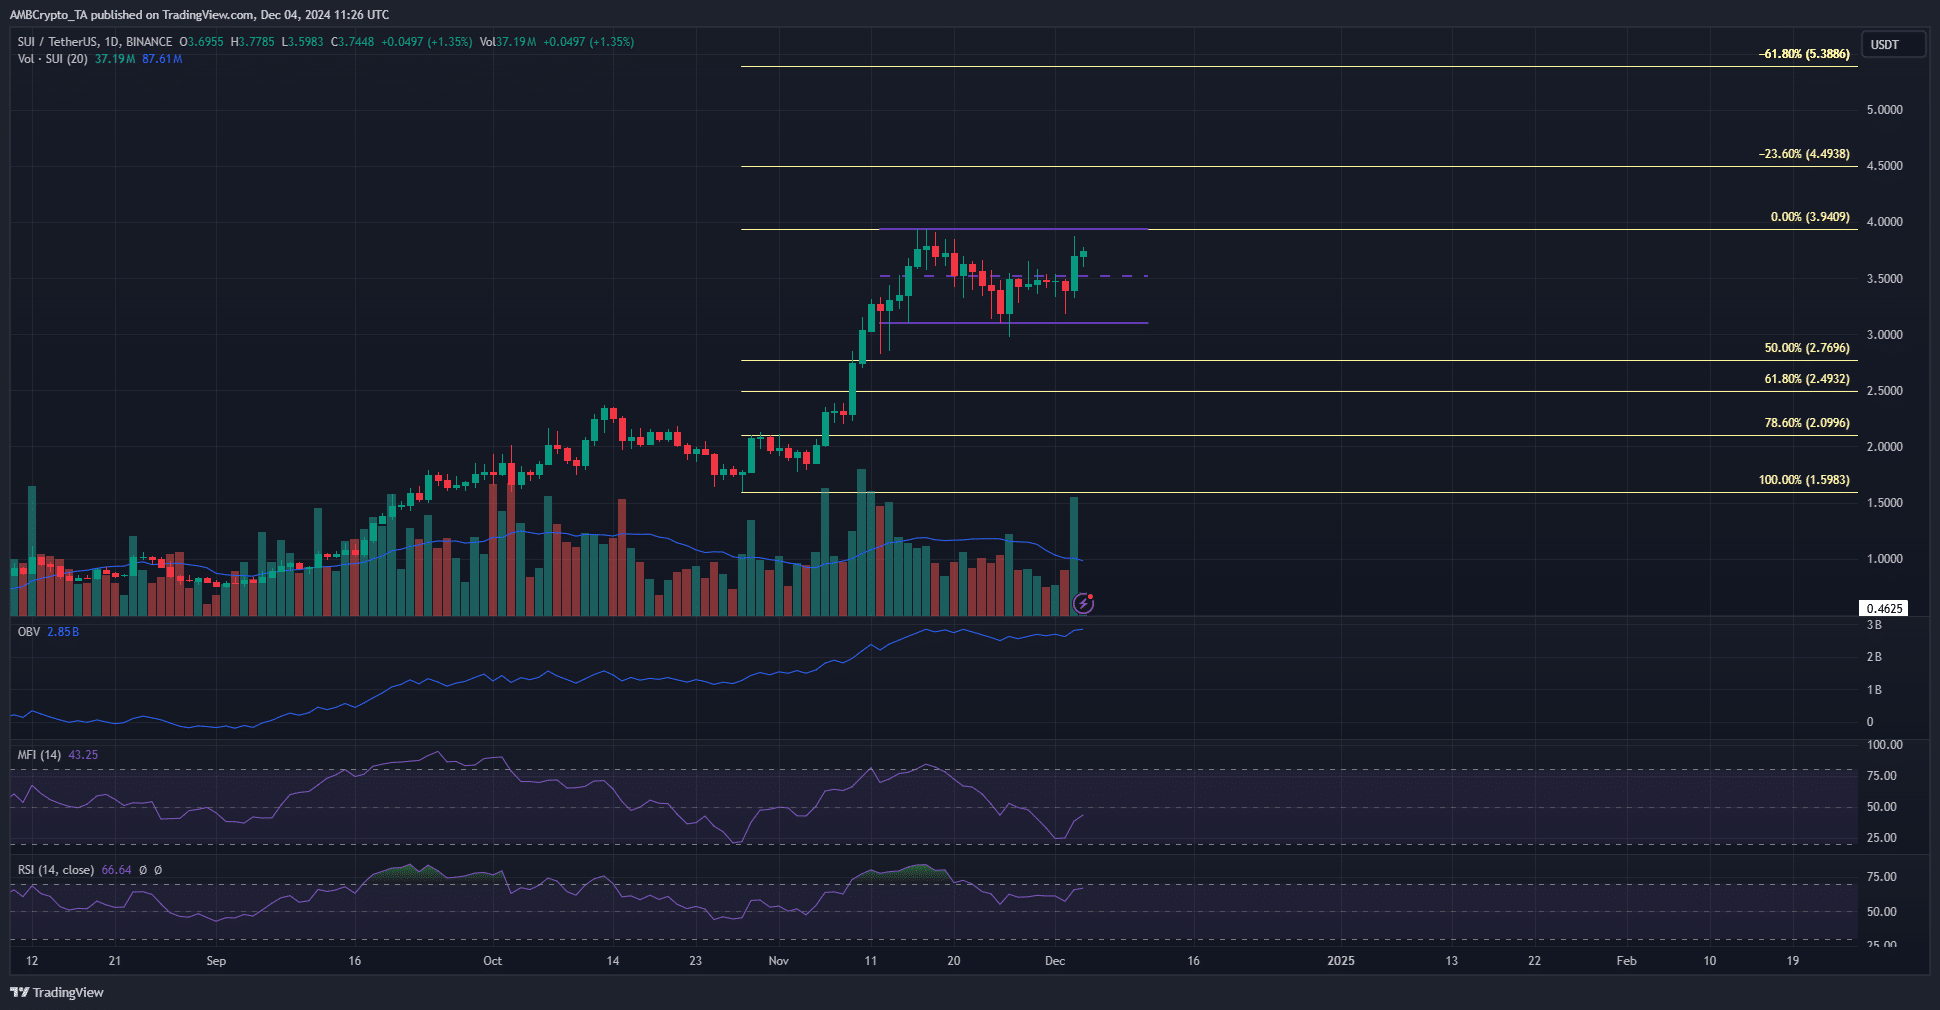
The daily chart for SUI highlights a persistently bullish market structure. Recent higher lows at $2.82 and $2.97 confirm this trend. A daily close below $2.97, however, could signal a break in market structure, potentially paving the way for a deeper decline.
The Relative Strength Index (RSI) has held steady at 60 over the past four weeks, consistently above the neutral 50 mark, which supports the ongoing bullish trend. While price action has been confined within a range of $3.1 to $3.94 over the last ten days, the mid-point at $3.52 was recently breached, hinting at a potential move toward the range highs and possibly a new all-time high.
Volume Indicators Reflect Mixed Signals

On the volume front, the On-Balance Volume (OBV) has shown a steady uptrend, indicative of significant buying pressure. In contrast, the Money Flow Index (MFI) has exhibited a downward trend over the past ten days, suggesting weakening strength during the current consolidation phase.
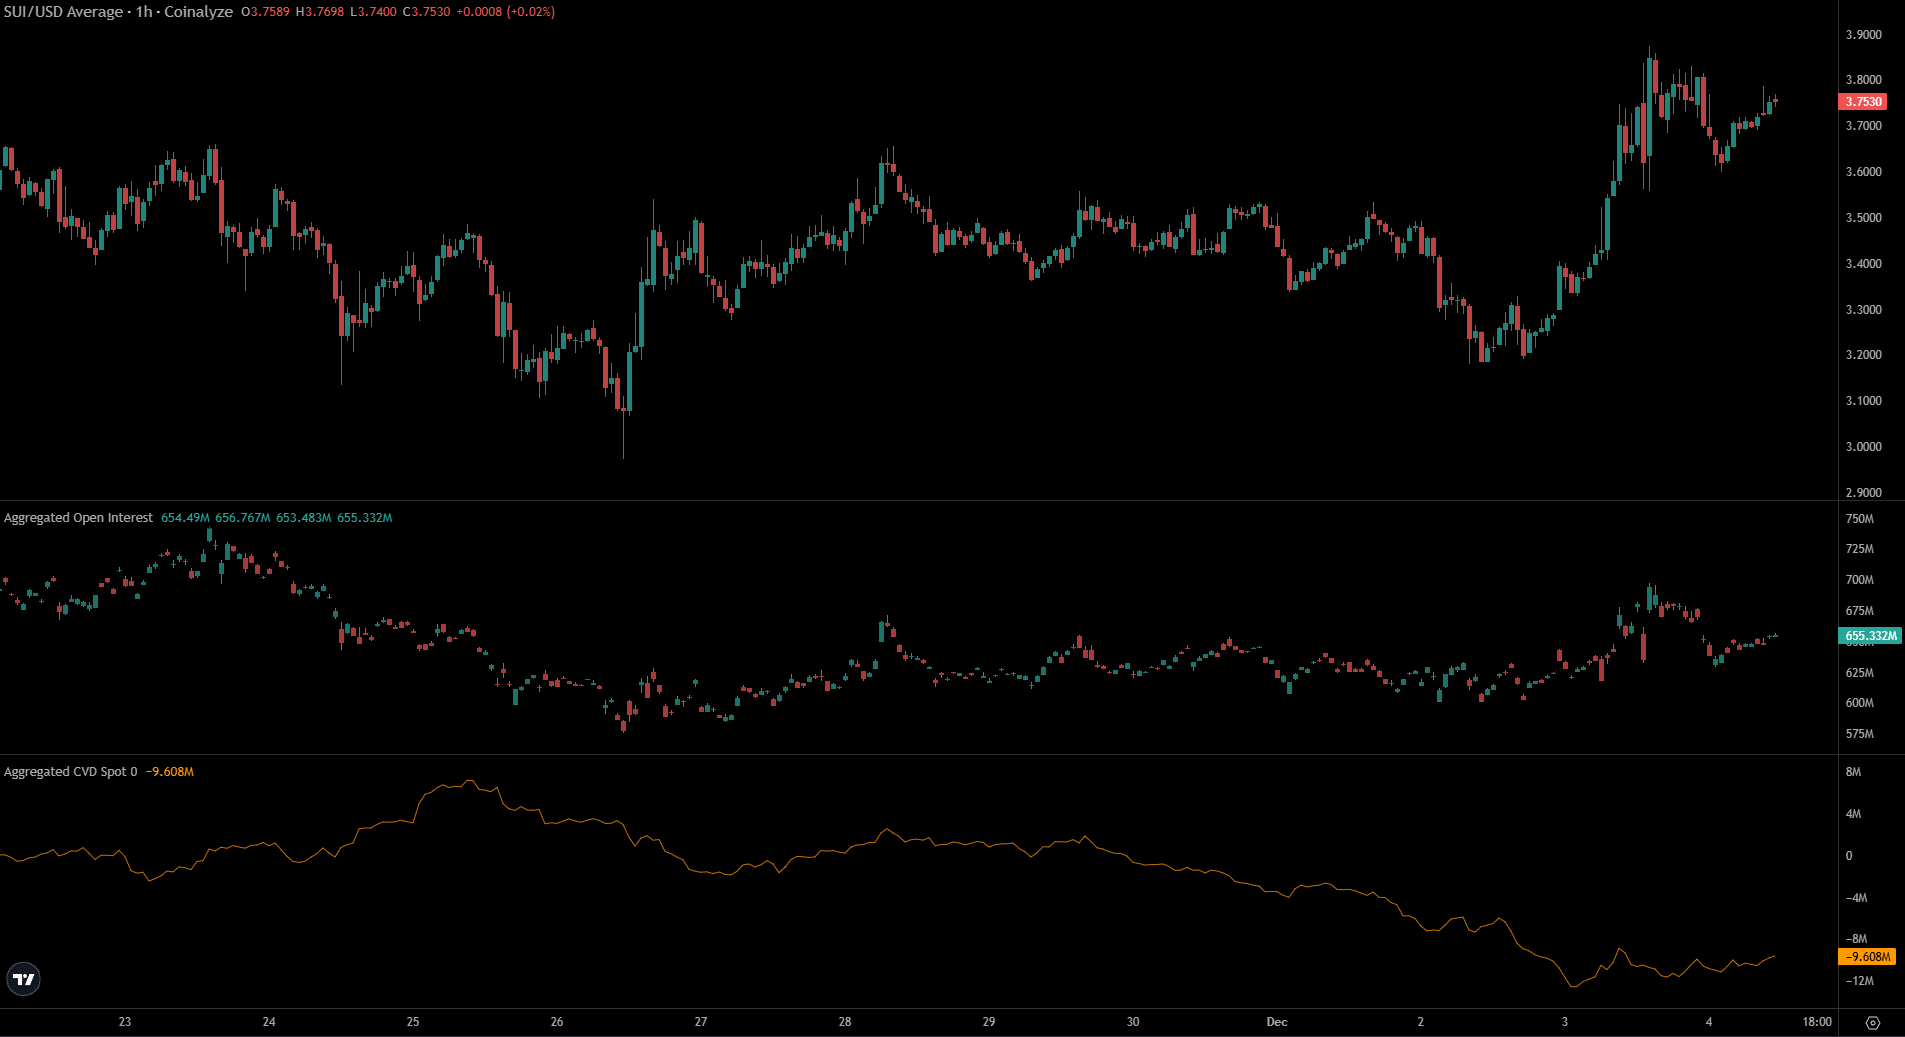
Adding to the caution, the spot Cumulative Volume Delta (CVD) has failed to trend upward, pointing to reduced demand in the spot markets. This aligns with the MFI’s findings and hints that a breakout from the current range may require additional time.
Liquidity Clusters and Potential Price Movements
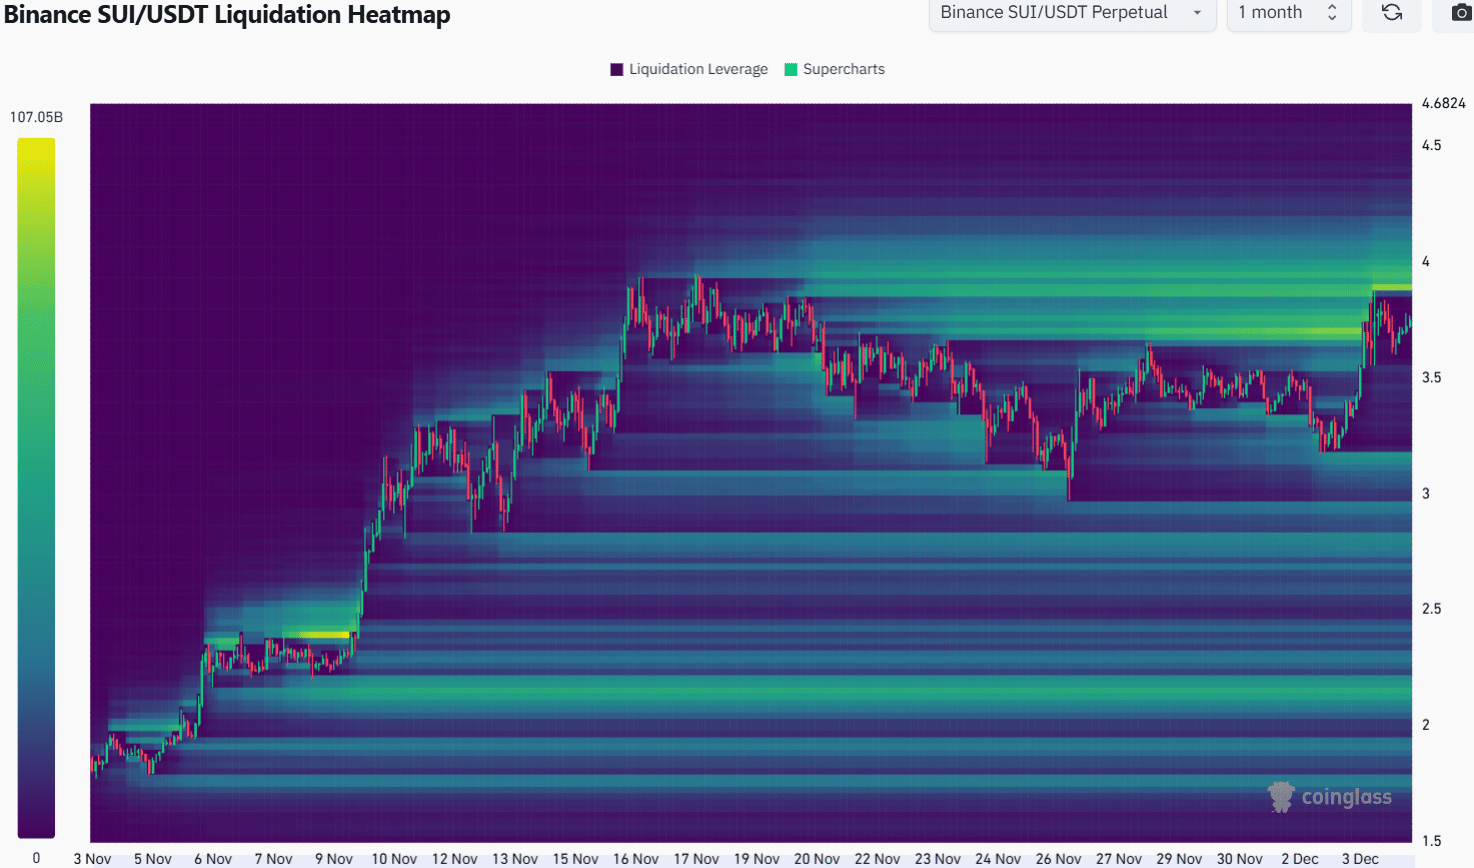
A review of the liquidation heatmap reveals significant liquidity clusters at $4 and $3.17. SUI’s price may collect liquidity at the lower levels, such as $3.17, before targeting higher resistance levels. This behavior is consistent with typical range breakouts, where deviations below key support levels flush out long liquidations before a price rally resumes.
Open Interest (OI) trends also reflect mixed signals. While OI surged during SUI’s rapid price gains on December 3, it dropped by $45 million in the past 20 hours, indicating profit-taking among bullish speculators.
As SUI consolidates near its all-time high, traders should monitor key support levels at $3.2 and $3.5. A dip toward these levels could present a buying opportunity if bullish momentum persists. However, the current mixed signals from volume indicators warrant cautious optimism.

A breakout above $3.94 could mark the beginning of another leg upward, but until then, SUI’s price action may remain within its established range. Traders should prepare for short-term dips while keeping an eye on long-term bullish targets.
Disclaimer: The information in this article is for general purposes only and does not constitute financial advice. The author’s views are personal and may not reflect the views of Chain Affairs. Before making any investment decisions, you should always conduct your own research. Chain Affairs is not responsible for any financial losses.
I’m your translator between the financial Old World and the new frontier of crypto. After a career demystifying economics and markets, I enjoy elucidating crypto – from investment risks to earth-shaking potential. Let’s explore!


