
|
Getting your Trinity Audio player ready...
|
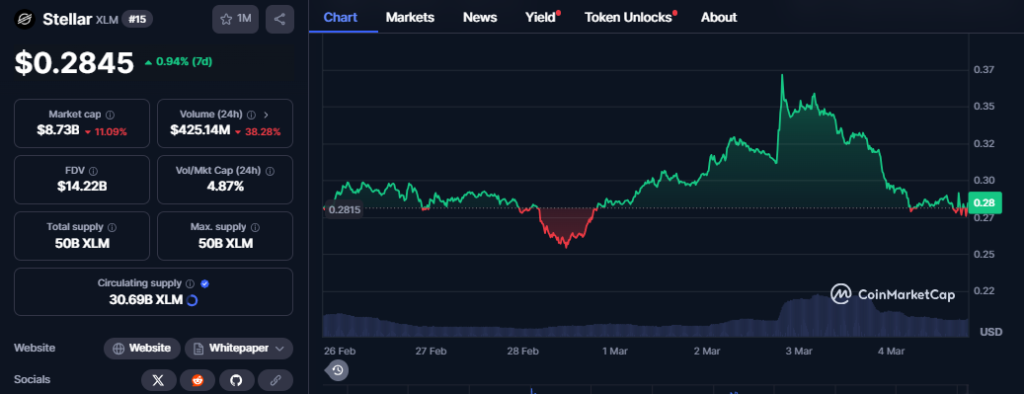
Stellar’s [XLM] recent price movements have attracted attention due to significant volatility, strong rallies, and sharp pullbacks. After an initial surge, the price corrected by 24.6%, falling from $0.37963 to $0.2855. This decline followed a rally fueled by FOMO buying, with profit-taking causing the price to retreat.
The drop tested a critical support range between $0.26 and $0.27, an area that has historically shown resilience. If this support holds, accumulation could lead to a rebound, but a break below $0.26 could signal further decline toward $0.22. Traders are closely monitoring price action, trend shifts, and market sentiment to gauge whether XLM is set for another rally or facing deeper declines.
Technical Analysis and Key Indicators
XLM’s 1-hour chart reveals a break from its uptrend, with the price dipping from $0.3317 to $0.2855. The 7-period Simple Moving Average (SMA) at $0.2985 signaled a bearish trend as the price moved below the trendline. The Rate of Change (ROC) at -12.13 suggests potential for short-term recovery, but the MACD at -0.00347, with a signal line at -0.01278, indicates continued weakness.

For XLM to turn bullish again, it must reclaim the $0.2985 level. If the price fails to do so, a retest of the $0.27 support level is possible. A bullish MACD crossover would signal a trend reversal, while prolonged bearish momentum may delay recovery.
Market Volatility and Price Action
XLM’s price volatility has been significant, with fluctuations ranging from $0.37963 to $0.2855. The Volatility Index, currently at $0.29240, highlights sharp price swings. If volatility drops below 0.25, consolidation near $0.27 could offer stability. However, a surge above 0.30 could lead to further declines, with historical data suggesting that volatility spikes beyond 0.35 often precede sharp corrections.

Trader Sentiment and Long/Short Ratios
The Long/Short Ratio, which tracks trader positioning, provides insight into market sentiment. On March 3, the Taker Buy/Sell Volume ratio peaked at 1.30, signaling bullish dominance. However, the correction to $0.2855 suggests that profit-taking and short covering are in play. A drop below 1.0 in the ratio could signal growing bearish sentiment, while a rebound above 1.2 might support a recovery toward $0.30.
Also Read: Stellar (XLM) Price Analysis: Key Levels, Market Trends, and Future Predictions
XLM’s recent volatility underscores a market in flux. With price action testing key support levels and sentiment shifting, traders must stay vigilant. The outcome will depend on how XLM reacts to critical levels and whether volatility remains manageable in the coming days.
Disclaimer: The information in this article is for general purposes only and does not constitute financial advice. The author’s views are personal and may not reflect the views of Chain Affairs. Before making any investment decisions, you should always conduct your own research. Chain Affairs is not responsible for any financial losses.
I’m a crypto enthusiast with a background in finance. I’m fascinated by the potential of crypto to disrupt traditional financial systems. I’m always on the lookout for new and innovative projects in the space. I believe that crypto has the potential to create a more equitable and inclusive financial system.