
|
Getting your Trinity Audio player ready...
|
Key Takeaways:
- $79.8M in longs under $0.40 could trigger cascading liquidations if support breaks.
- RSI divergence mirrors December 2024, when XLM dropped over 40%.
- Key support lies at $0.44 and $0.40; losing both could accelerate a move toward $0.33 or lower.
Stellar (XLM) is showing signs of weakness despite hovering above $0.45. Technical indicators and on-chain data suggest growing risk of a sharp correction, especially if key support levels break. Leveraged positions below spot and a divergence in momentum are contributing to bearish pressure.
Leverage Cluster Below $0.40 Poses Cascade Risk
The most immediate concern for bulls is a significant buildup of leveraged long positions under $0.40. According to Bitget’s 30-day liquidation map for XLM/USDT, approximately $79.8 million in long positions are at risk compared to just $42.1 million in shorts. The largest cluster lies just below current price, suggesting even a small dip could trigger liquidations.
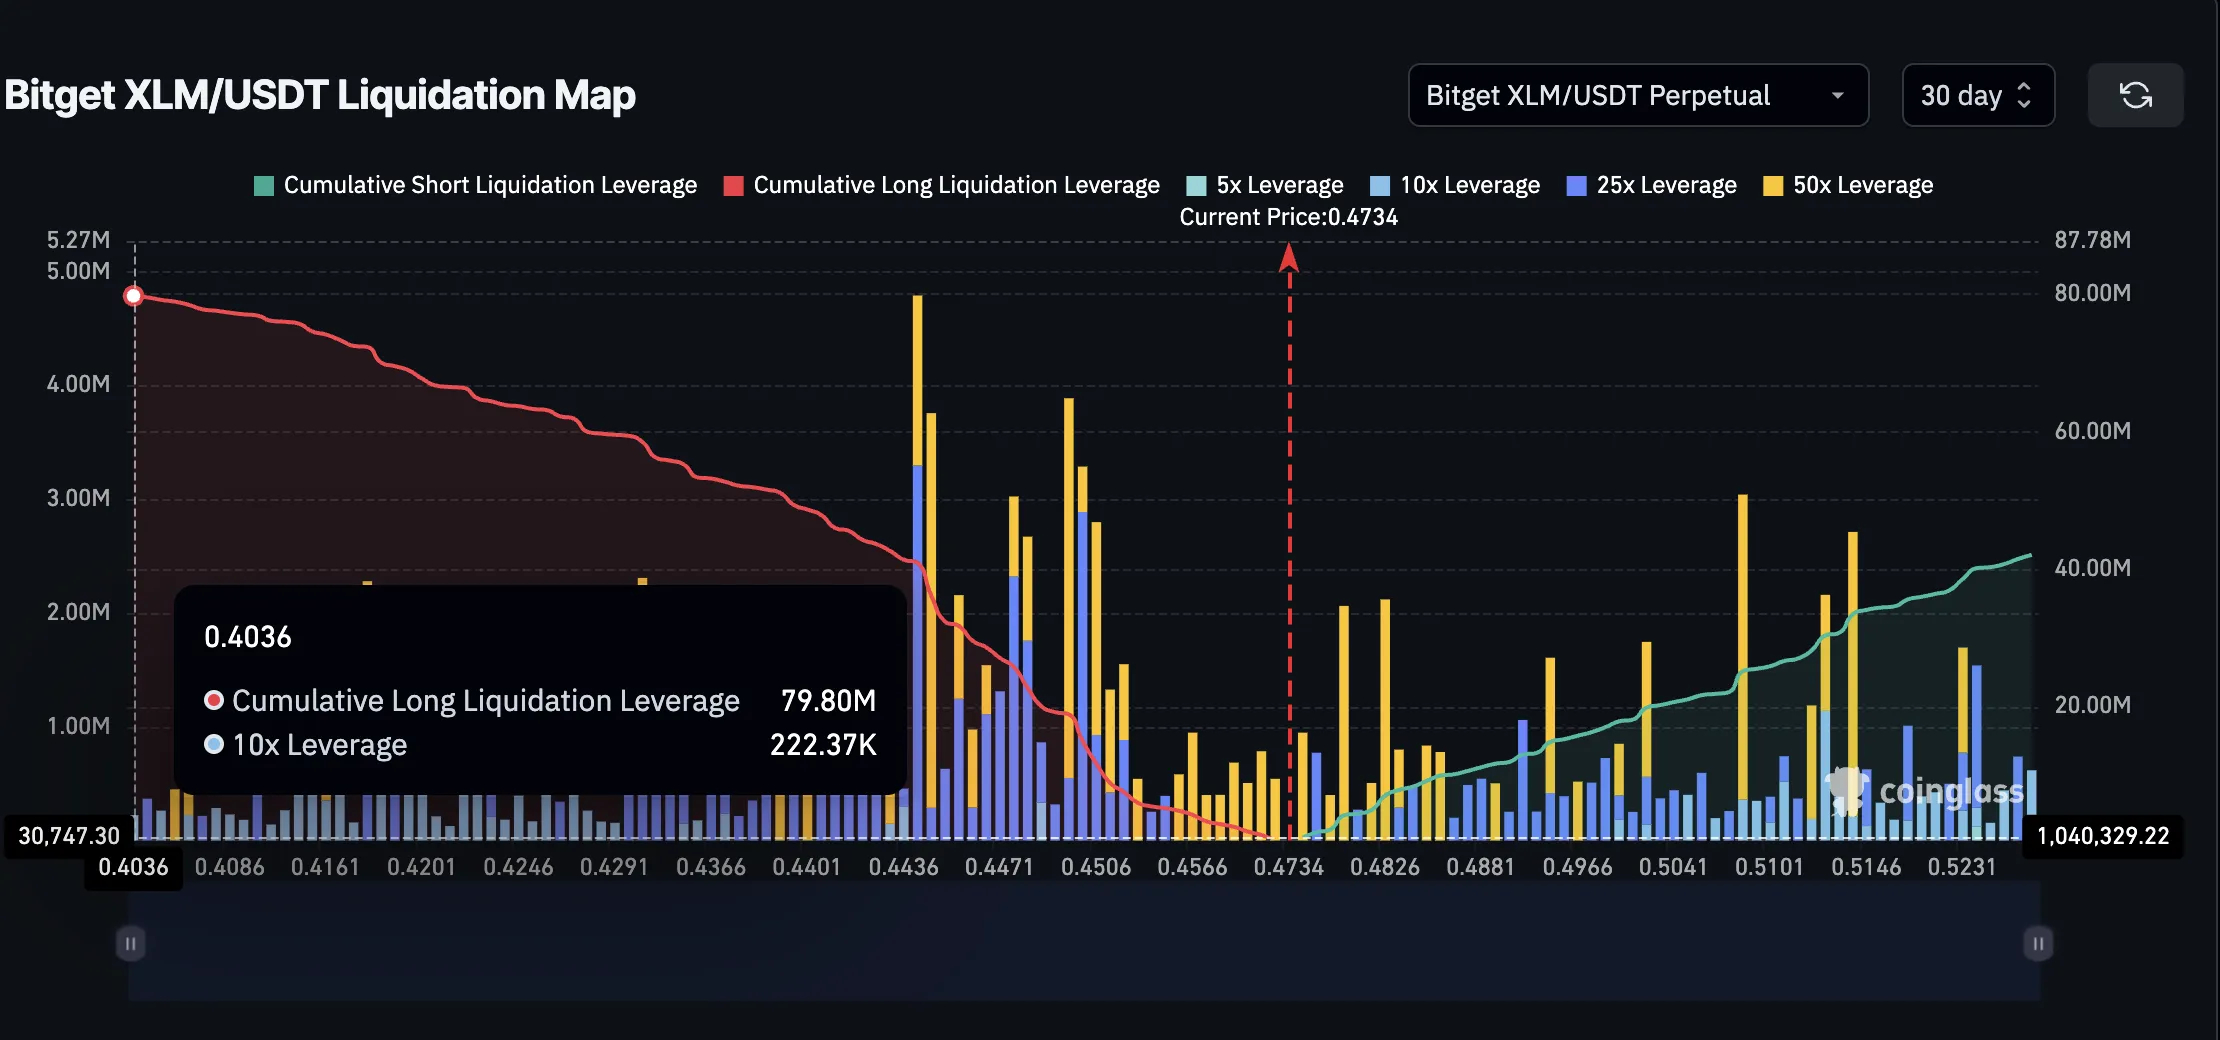
Liquidation maps plot areas where forced closures of leveraged positions occur. When price sits above a dense block of longs, a downward move can snowball—each level triggering the next, leading to a “cascade effect.”
Bearish RSI Divergence Mirrors December 2024 Crash
A technical red flag has emerged on XLM’s daily chart. Since July 14, price has held steady while the Relative Strength Index (RSI) has made lower highs, creating a classic bearish divergence. This same pattern preceded a 40% crash in December 2024, lending weight to the current setup.
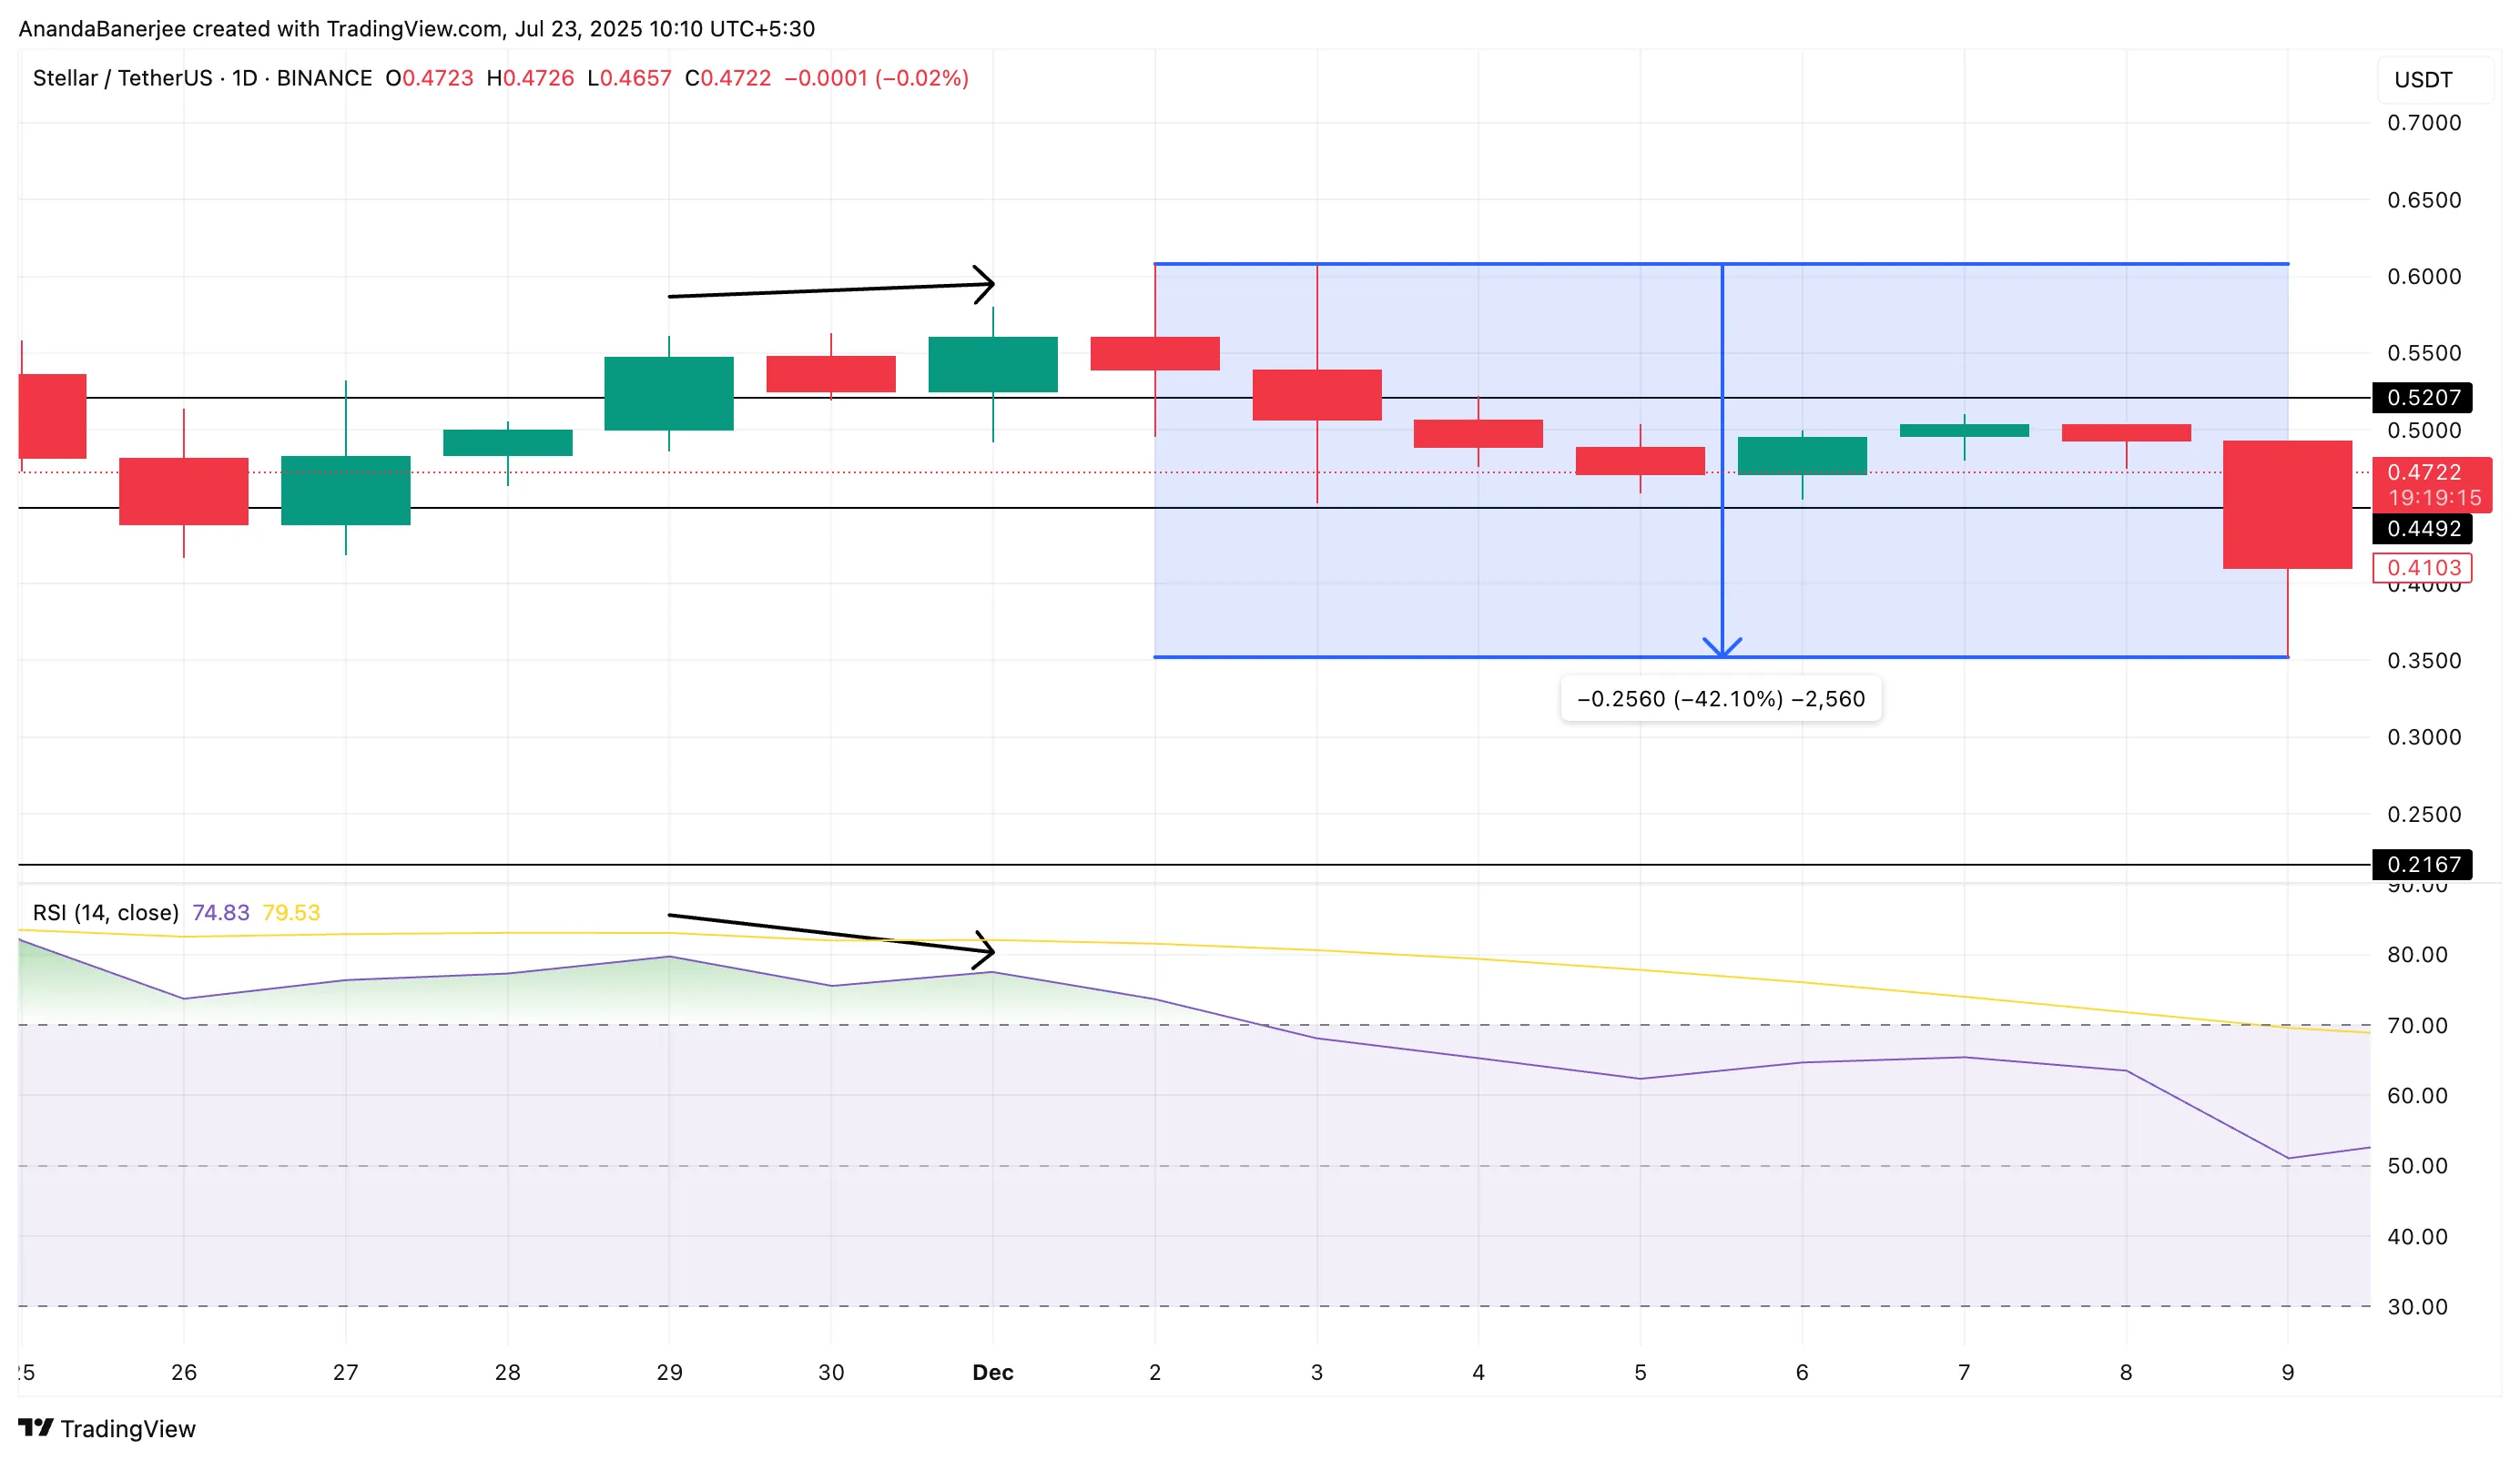
RSI divergence indicates fading momentum—when price rises or stays flat, but buying strength weakens. This lack of confirmation often signals a reversal, especially when leverage is high and support levels are close.
Support at $0.44 Critical; Below $0.40 Opens Bearish Floodgates
If selling pressure picks up, the first key level to watch is $0.44, a 0.236 Fibonacci retracement from the $0.21 to $0.52 range. XLM has bounced here before, but a close below would shift focus to $0.40—the critical threshold tied to the liquidation cluster.
Also Read: Stellar (XLM) Surges 80% — Analysts Predict Bullish Breakout to $0.60 and Beyond
A clean break under $0.40 could accelerate losses toward $0.33, a level that aligns with both Fibonacci projections and the December decline model. Further downside toward $0.28 is possible if bearish momentum fully takes over.
XLM is approaching a pivotal moment. Heavy leveraged exposure below current price, a clear RSI divergence, and waning buying pressure all point to rising downside risk. Unless Stellar closes above $0.52 with improving momentum, the path of least resistance appears downward.
Disclaimer: The information in this article is for general purposes only and does not constitute financial advice. The author’s views are personal and may not reflect the views of Chain Affairs. Before making any investment decisions, you should always conduct your own research. Chain Affairs is not responsible for any financial losses
I’m your translator between the financial Old World and the new frontier of crypto. After a career demystifying economics and markets, I enjoy elucidating crypto – from investment risks to earth-shaking potential. Let’s explore!