|
Getting your Trinity Audio player ready...
|
Shiba Inu (SHIB) continues to assert itself as the second-largest meme coin, boasting a market cap surpassing $7.8 billion, roughly half that of Dogecoin (DOGE). Despite SHIB experiencing a 3.13% decline over the past 24 hours, recent price action has sparked optimism among traders, suggesting potential opportunities for the final quarter of the year.
As of now, SHIB is trading near levels that previously triggered a 300% rally at the start of the year. While replicating such a meteoric rise remains uncertain, the patterns emerging during its correction phase offer critical insights into the months ahead.
Symmetrical Triangle Pattern – Breakout Looming?
Shiba Inu’s current price action is marked by a symmetrical triangle pattern on its daily chart, typically indicative of market consolidation. Following a downward break, SHIB reached a low of $0.00001264, which initially appeared to be the bottom. However, the August 5th market crash pushed the price lower to $0.00001081. This new low was quickly corrected, with SHIB/USDT returning to its consolidation phase within the tightening triangle.
Such contraction in price often signals an impending breakout, as markets typically move from phases of contraction to expansion. Traders are now keeping a close eye on the triangle’s base for key support levels. A break below this base could indicate a bearish shift, although this scenario is less likely given SHIB’s historical trends.
While short-term price movements can be volatile, the long-term outlook offers more predictability. If SHIB manages to maintain support at current levels, traders could anticipate a significant price move in the coming weeks.
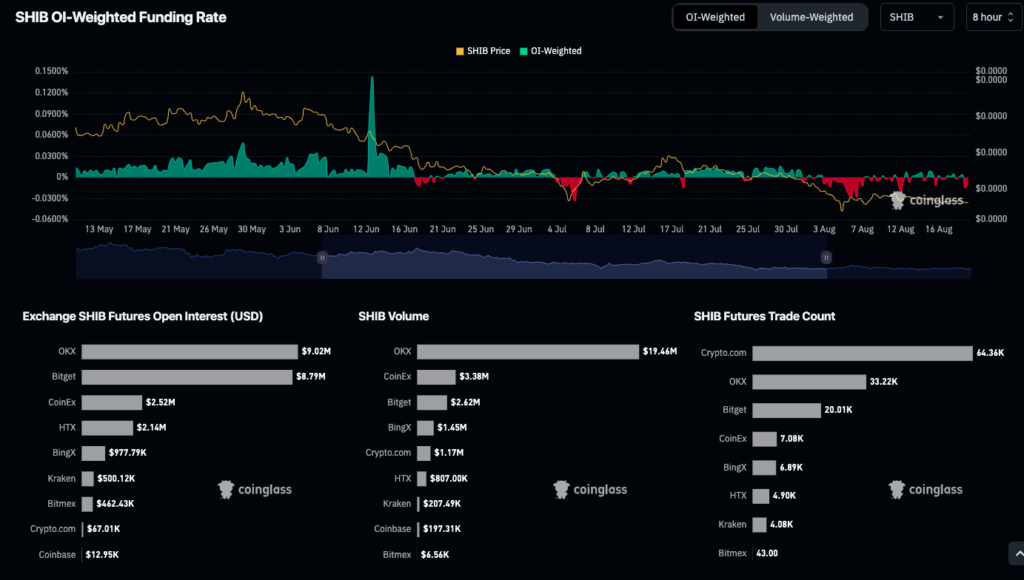
Futures Market and Open Interest Favor Bulls
An analysis of Shiba Inu’s futures market shows a bullish sentiment. Total liquidations reveal that long traders outnumber short traders, despite the broader market’s decline since April. SHIB’s futures market data indicates that net long positions stand at 38%, compared to 32% for net shorts, with a delta of 36% between them. Although these figures are modest, they are consistent with levels that have previously seen SHIB surge in price.
Furthermore, open interest data suggests the potential for upward momentum. SHIB’s open interest below its current price is approximately $35.866 million, signaling that traders are poised to invest heavily if the price touches $0.000011. Another significant cluster of open interest sits at $0.000021, holding $43.933 million, pointing to conservative traders targeting this level for future price increases.
Whale Accumulation Signals Confidence
Shiba Inu’s holding distribution reveals that whales—those holding more than $10 million in SHIB—have increased their holdings by 3.39% in the past 30 days, despite the recent price dip. This accumulation phase suggests growing confidence among large holders, potentially setting the stage for upward price movement. Retail traders, on the other hand, have shown mixed activity, with slight increases, decreases, or no change in holdings, balancing overall market distribution.
While Shiba Inu’s recent price dip may cause short-term concerns, whale accumulation and bullish futures market data point to a potential breakout in the near future. As SHIB continues to consolidate, traders should watch for key support levels and open interest indicators that may signal a return to higher price levels.
Disclaimer: The information in this article is for general purposes only and does not constitute financial advice. The author’s views are personal and may not reflect the views of Chain Affairs. Before making any investment decisions, you should always conduct your own research. Chain Affairs is not responsible for any financial losses.