|
Getting your Trinity Audio player ready...
|
Polkadot (DOT) was trading at $7.20, marking a 2% increase over the last 24 hours. However, trading volume dropped by 9% to $290 million, hinting at weakening momentum. Over the past week, DOT has posted a notable 16% gain, but bearish indicators on the one-day chart suggest a potential price correction.

Head and Shoulders Pattern Hints at Downtrend
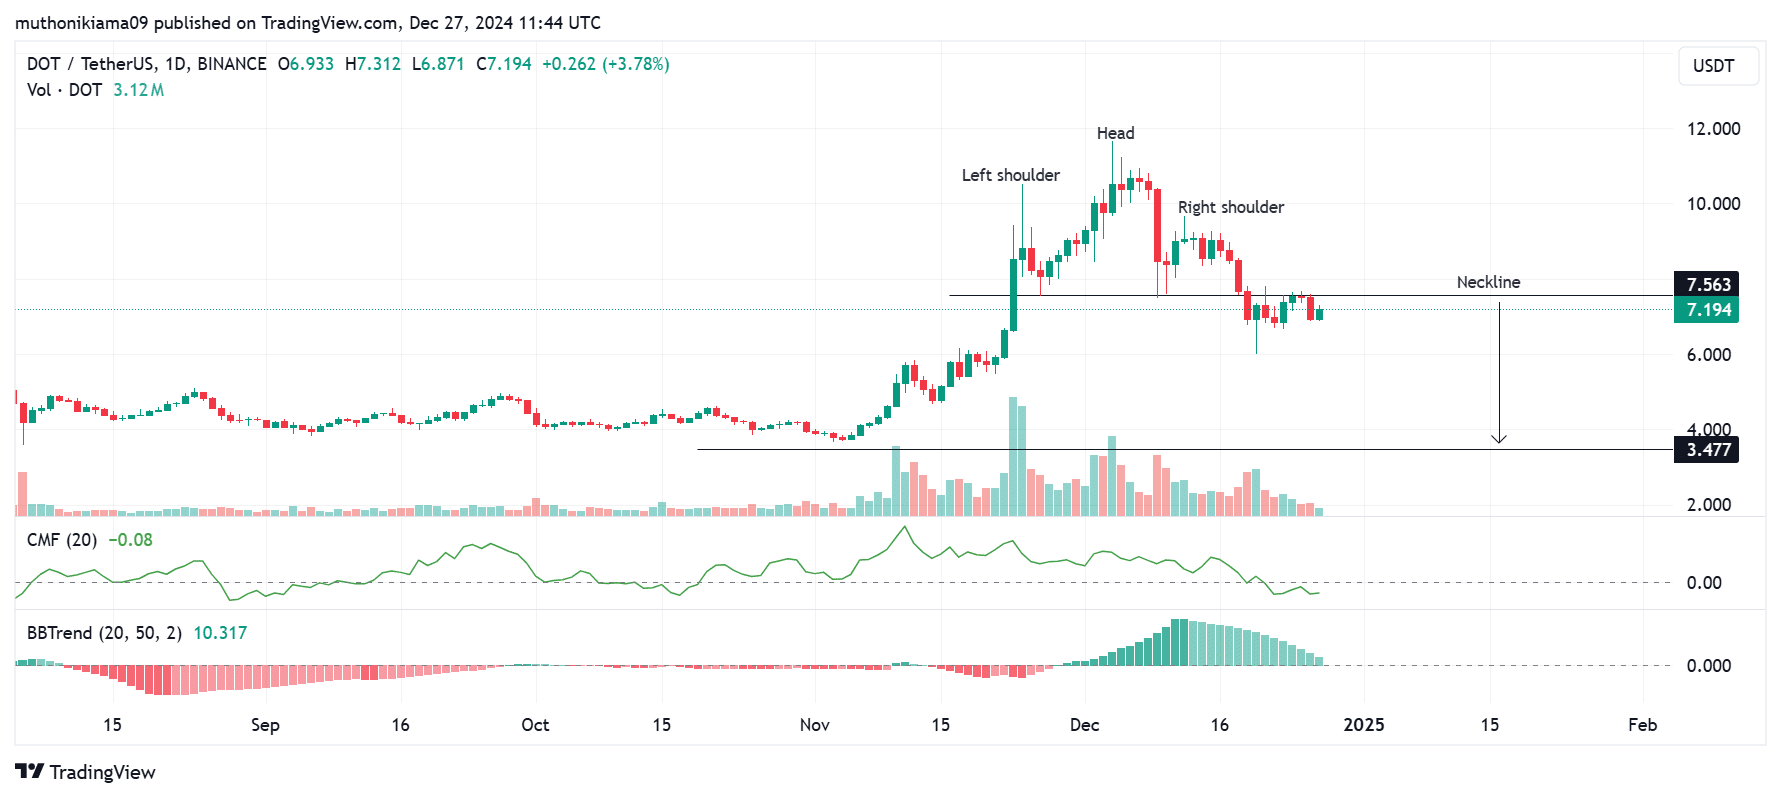
Polkadot’s one-day chart reveals a head and shoulders pattern—often a precursor to a bearish trend. Attempts to break above the critical resistance at $7.56 have repeatedly failed, reflecting buyer inactivity at higher levels. If this resistance continues to hold, sellers may seize control, potentially dragging DOT prices down by over 50% to $3.47.
Supporting this bearish outlook is the Chaikin Money Flow (CMF), which indicates higher selling pressure than buying activity. Additionally, the Bollinger Band Trend shows fading histogram bars, signaling weak bullish momentum and a possible continuation of the downtrend if buying interest remains muted.
On the other hand, a breakout above $7.56 could attract buyers and fuel a rally toward $9.20, provided there is sufficient market support.
Declining Network Activity Raises Concerns
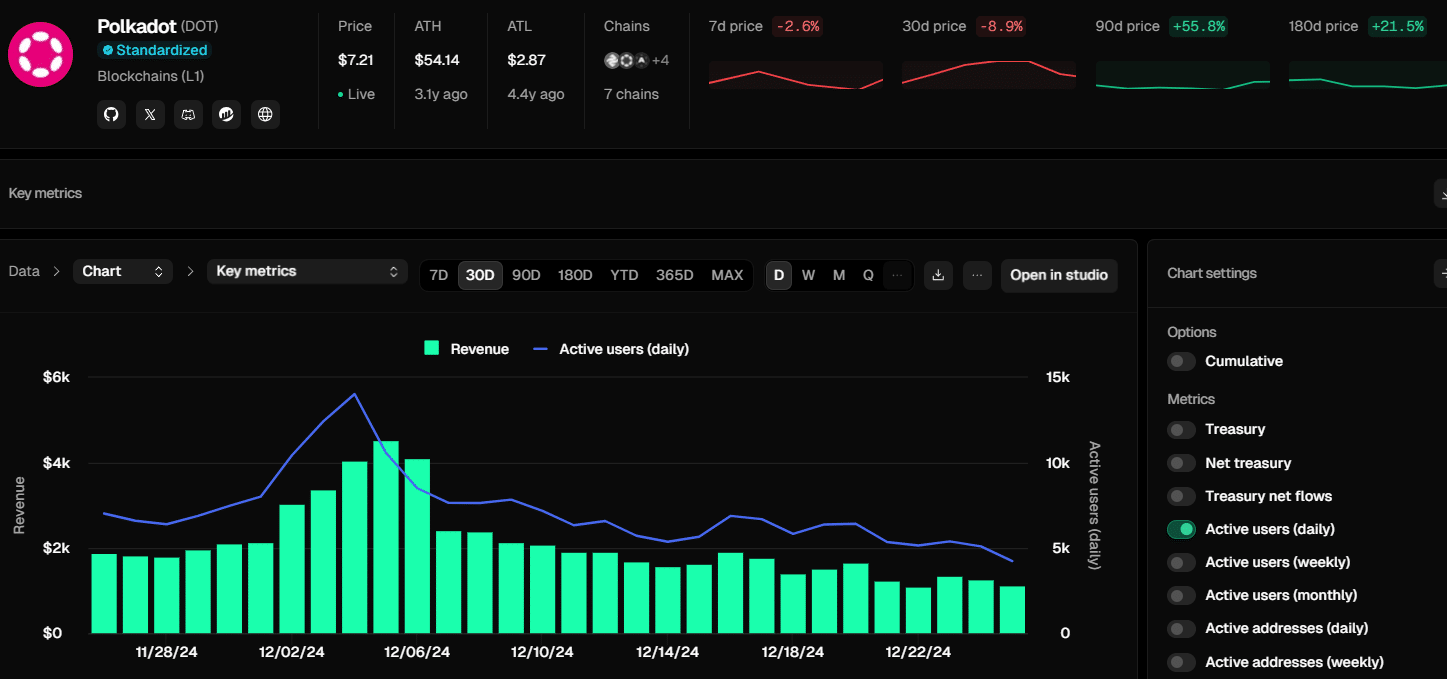
Polkadot’s network metrics paint a concerning picture. Data from TokenTerminal reveals that daily active users have fallen to 4,200—the lowest in 30 days—while daily revenue has dropped to $1,118. This decline in network activity could further strengthen bearish trends by undermining investor confidence.

A resurgence in activity will be crucial for reversing sentiment and supporting DOT’s price recovery. Without this, the network’s sluggish performance could amplify downward pressure.

Liquidation Risks Loom
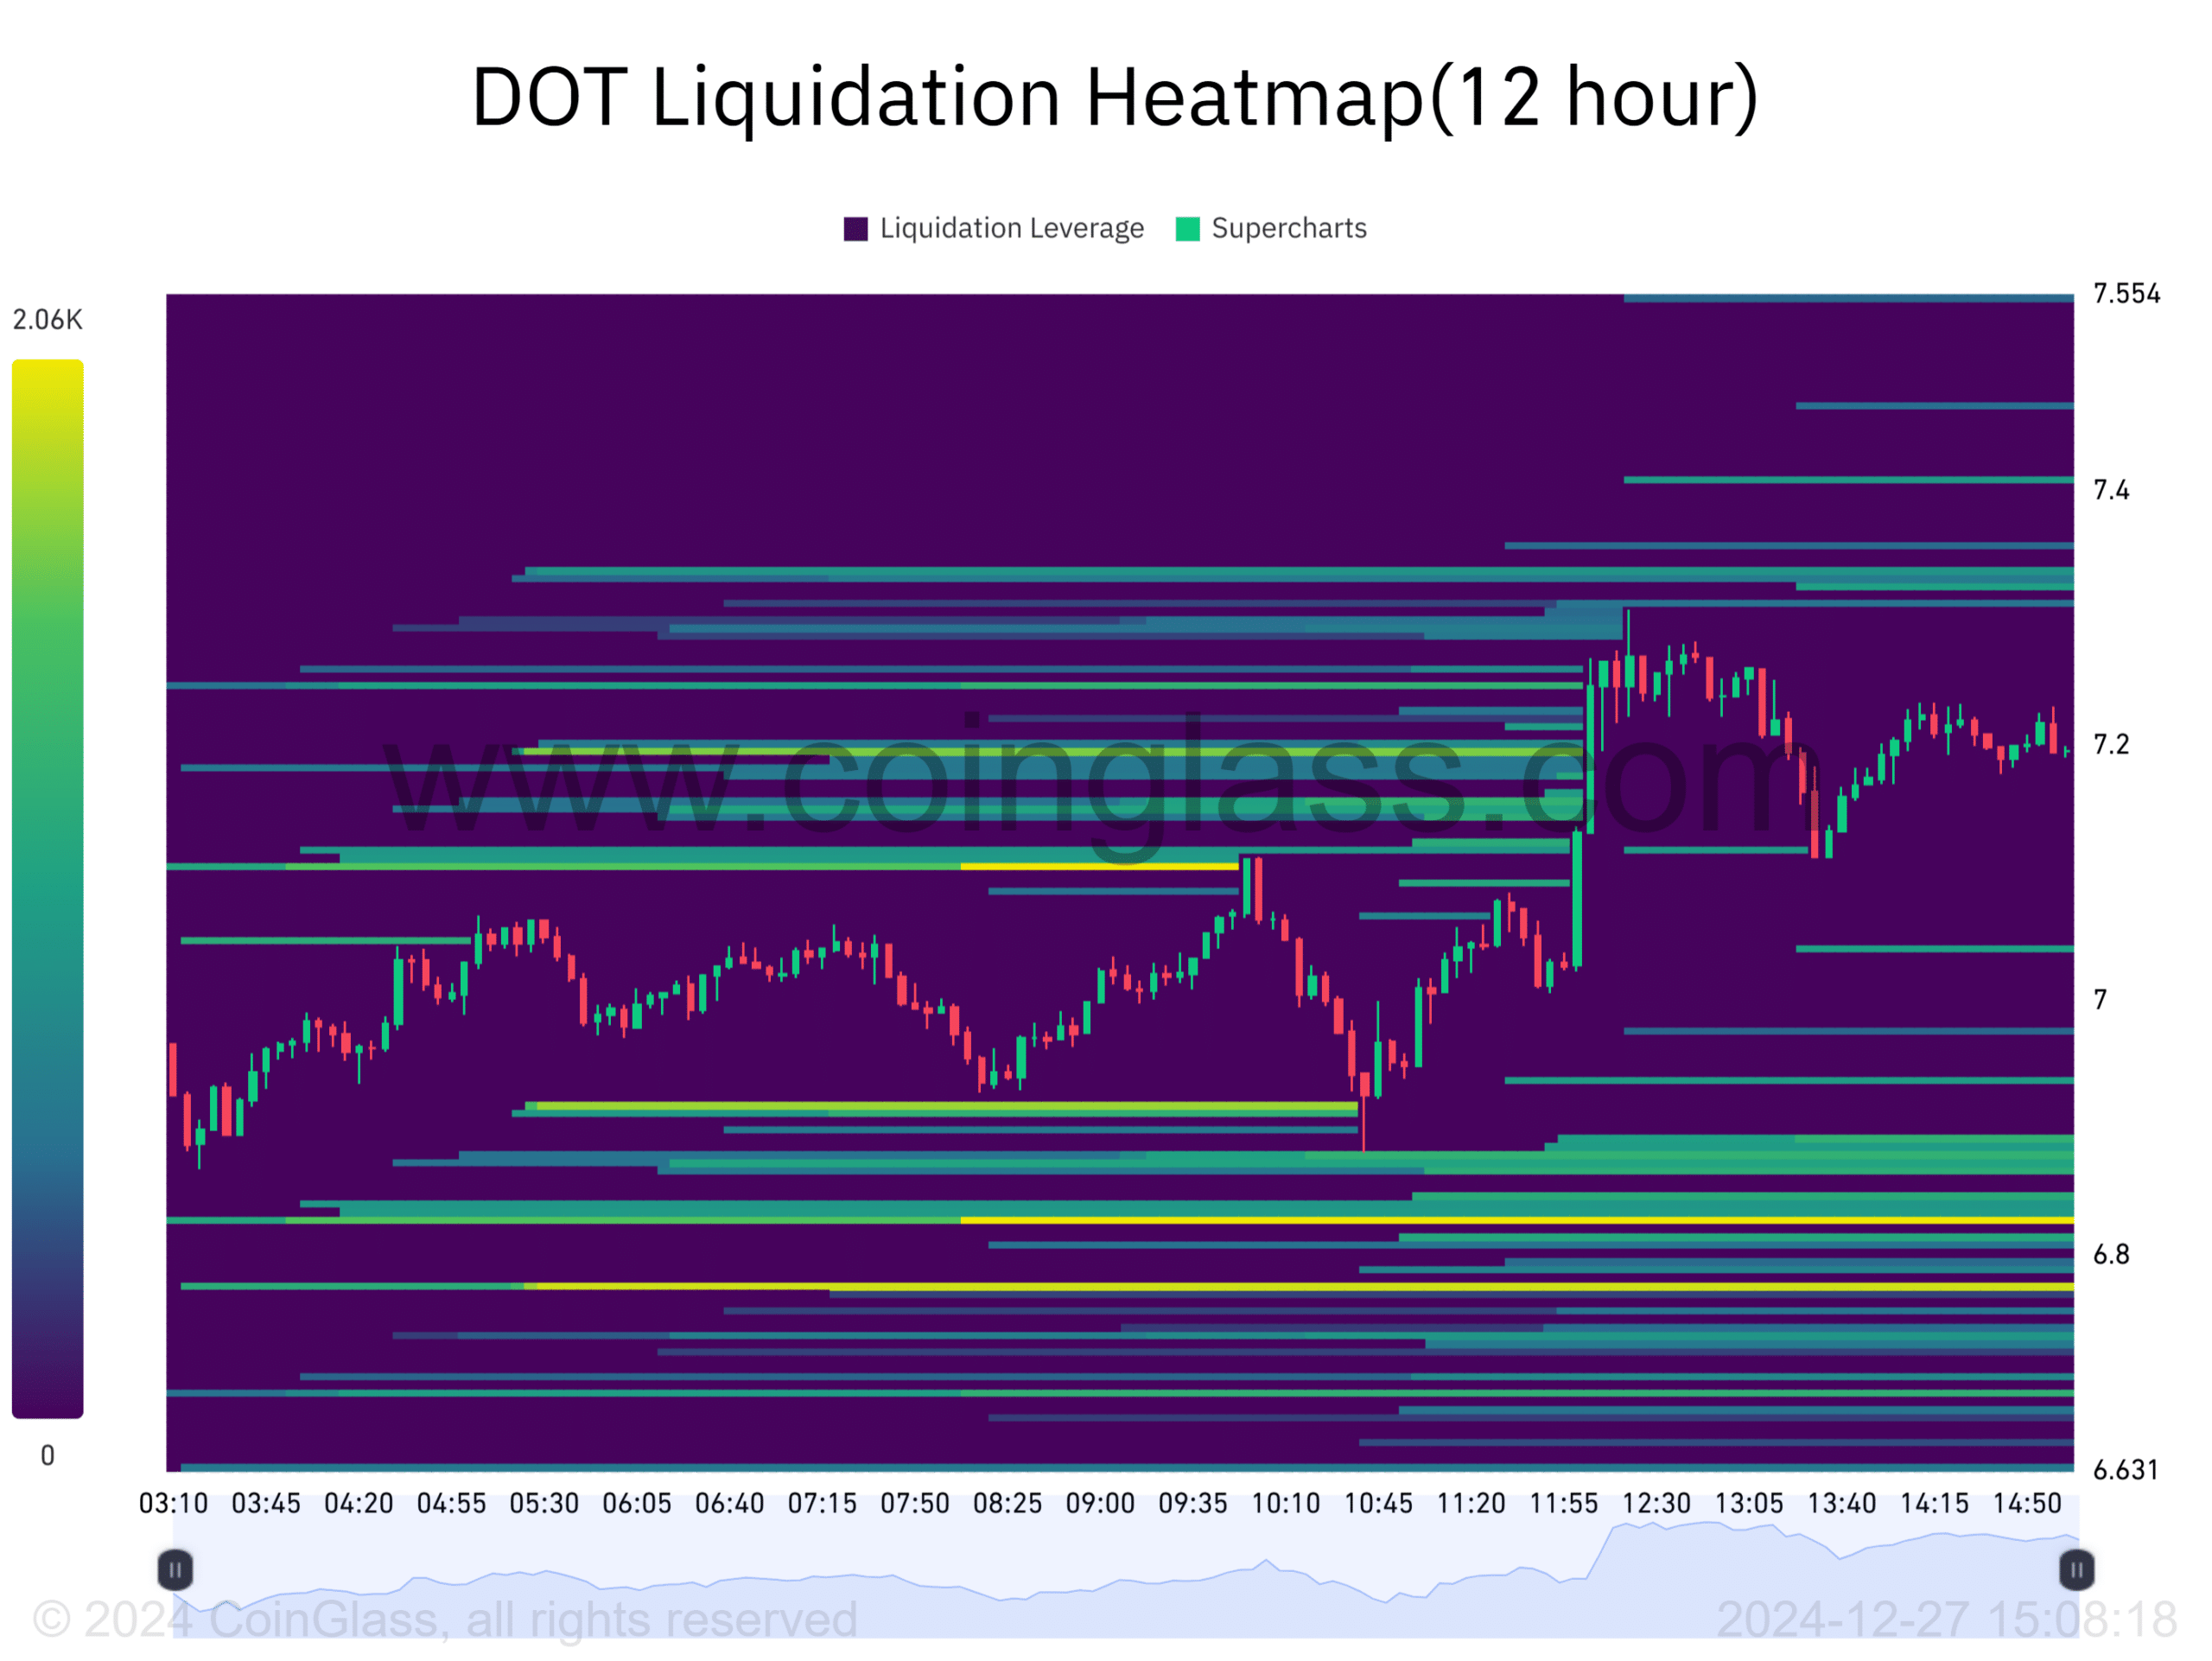
Polkadot’s liquidation heatmap suggests limited immediate liquidation levels around the current price. However, there is a notable liquidation zone at $6.80. If the price falls to this level, cascading long liquidations could exacerbate the decline.
Polkadot’s recent gains are overshadowed by emerging bearish signals and declining network activity. While a decisive breakout above $7.56 could revive bullish momentum, the current indicators suggest that DOT faces significant downside risks in the near term. Traders should closely monitor key support and resistance levels, as well as network activity, to gauge the altcoin’s next move.

Disclaimer: The information in this article is for general purposes only and does not constitute financial advice. The author’s views are personal and may not reflect the views of Chain Affairs. Before making any investment decisions, you should always conduct your own research. Chain Affairs is not responsible for any financial losses.
Also Read: Polkadot (DOT) Shows Bullish Momentum After Falling Wedge Breakout
I’m a crypto enthusiast with a background in finance. I’m fascinated by the potential of crypto to disrupt traditional financial systems. I’m always on the lookout for new and innovative projects in the space. I believe that crypto has the potential to create a more equitable and inclusive financial system.


