
|
Getting your Trinity Audio player ready...
|
The cryptocurrency market has faced mixed trends over the past two weeks, transitioning from bullish optimism to bearish caution. Meme coins like Pepe (PEPE) have felt the effects, with a noticeable dip in trading interest as the spotlight shifts back to Bitcoin (BTC). Despite this, technical indicators are suggesting that PEPE could be on the verge of a rebound, potentially setting the stage for a price reversal.
TD Sequential Buy Signal Points to Possible Reversal
Technical analysis of PEPE reveals promising signs for traders. The TD Sequential indicator, a well-known tool for predicting price trends, has triggered a buy signal on the daily chart. Historically, such signals have often preceded upward price movements, sparking interest from traders looking to capitalize on potential gains. As of the latest data, PEPE is trading at $0.00001791, reflecting a 2% increase in the past 24 hours, though it remains down by nearly 26% over the past week.
The TD Sequential presented a buy signal on the $PEPE daily chart, anticipating a price rebound! pic.twitter.com/4RUjW1kmwp
— Ali (@ali_charts) December 22, 2024
Traders are particularly focused on key price levels, including a resistance point near $0.00002201. The Bollinger Bands are also indicating that breaking this resistance could trigger a sustained rally, making PEPE a closely watched asset in the coming days.
Whale Activity Slows After November Surge
Despite the positive technical indicators, large transactions have been notably sparse. According to data from IntoTheBlock, PEPE saw a spike in whale activity in mid-November, with large transactions helping push the price to $0.000024. However, trading volume has since slowed, with only 240 large transactions recorded in the last 24 hours— the lowest in the past week. This slowdown aligns with PEPE’s price consolidation at around $0.00001791, suggesting a period of accumulation or reduced trading interest.
On-Chain Metrics Highlight Key Price Zones
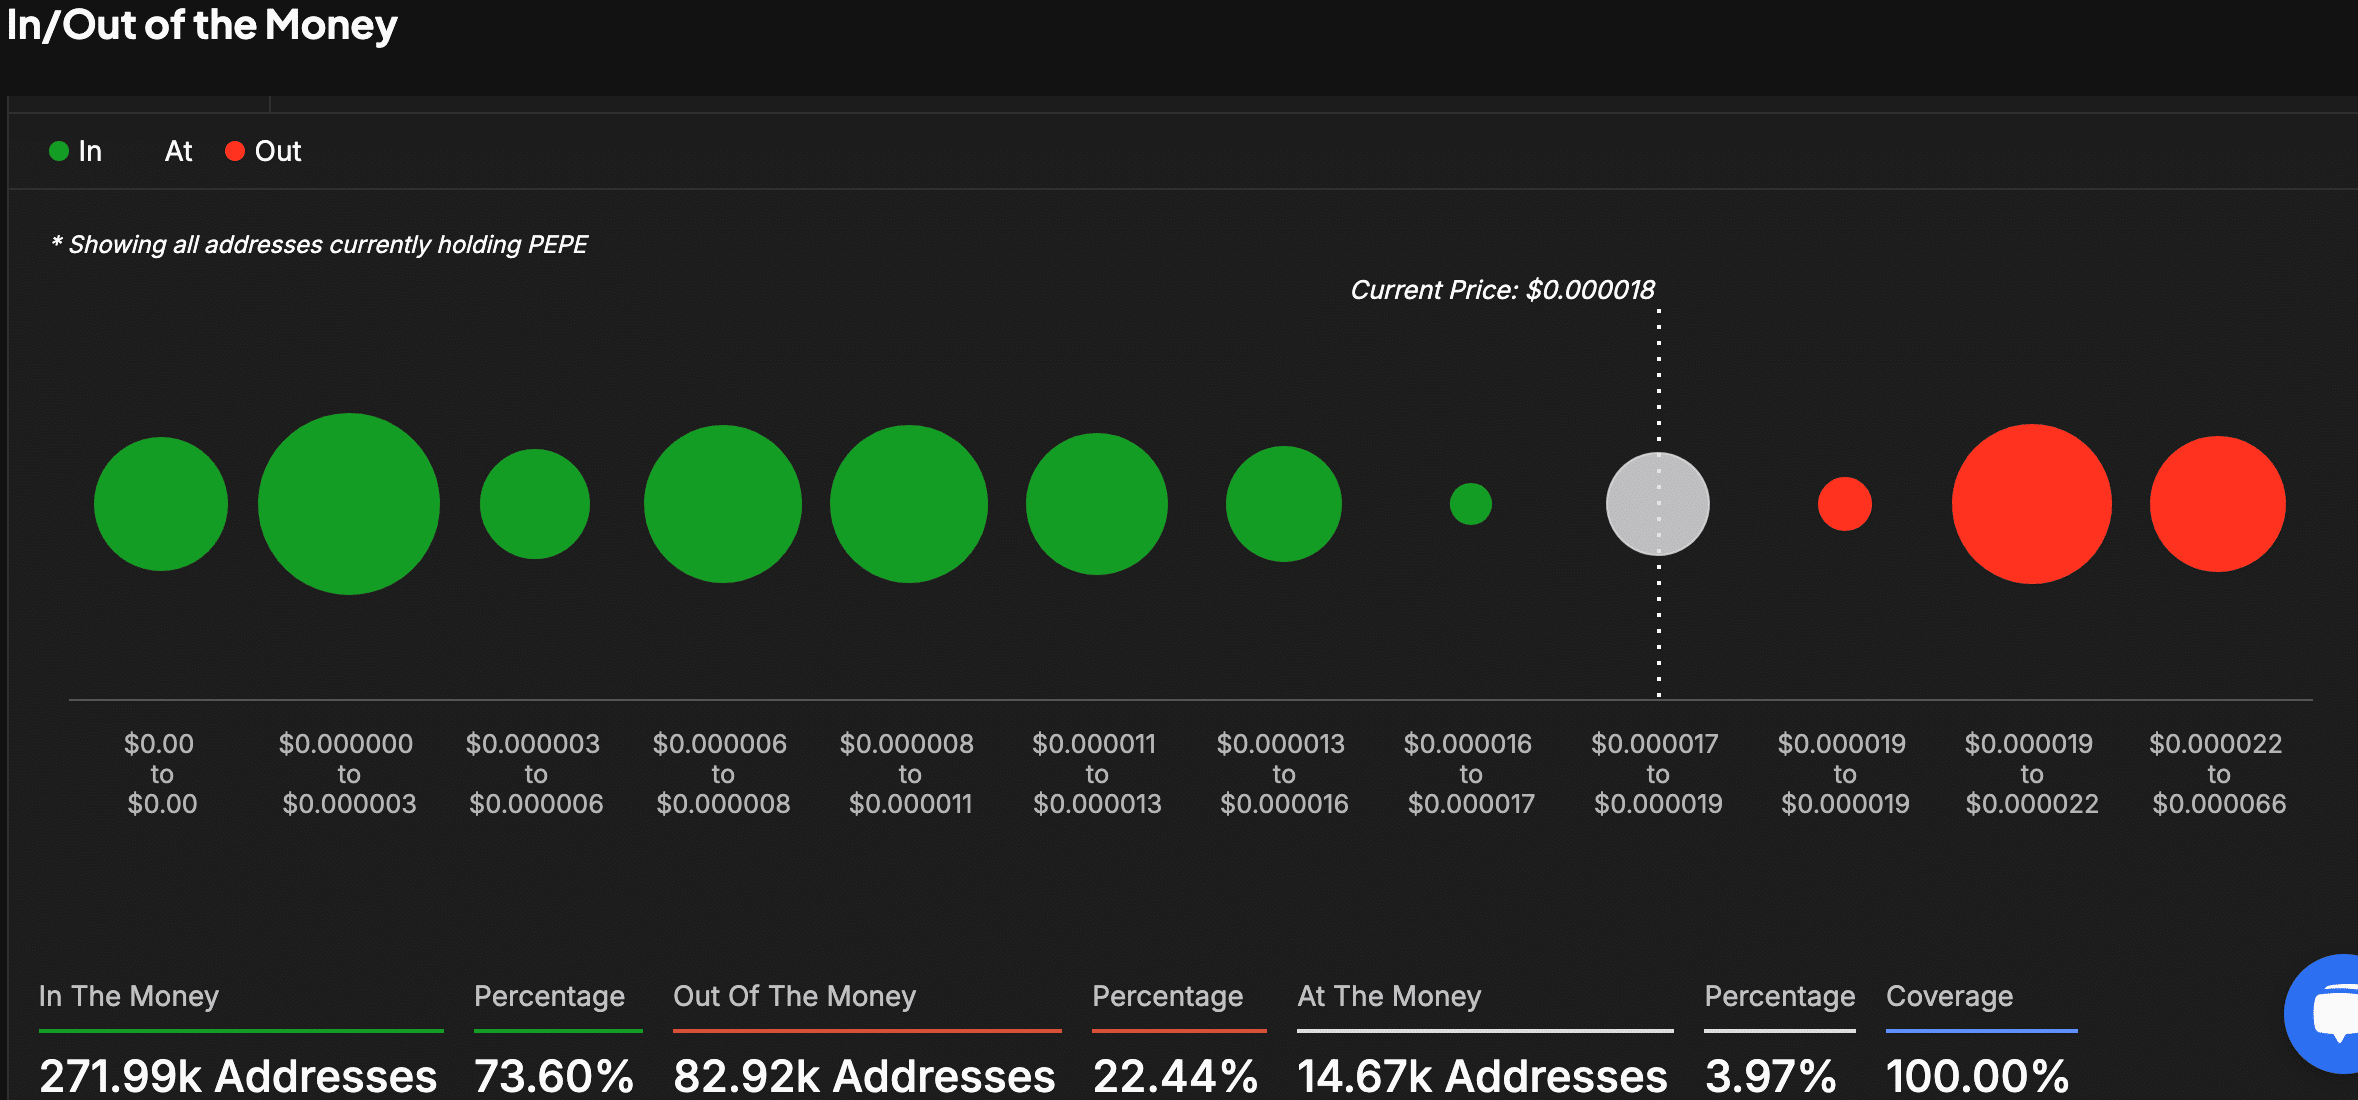
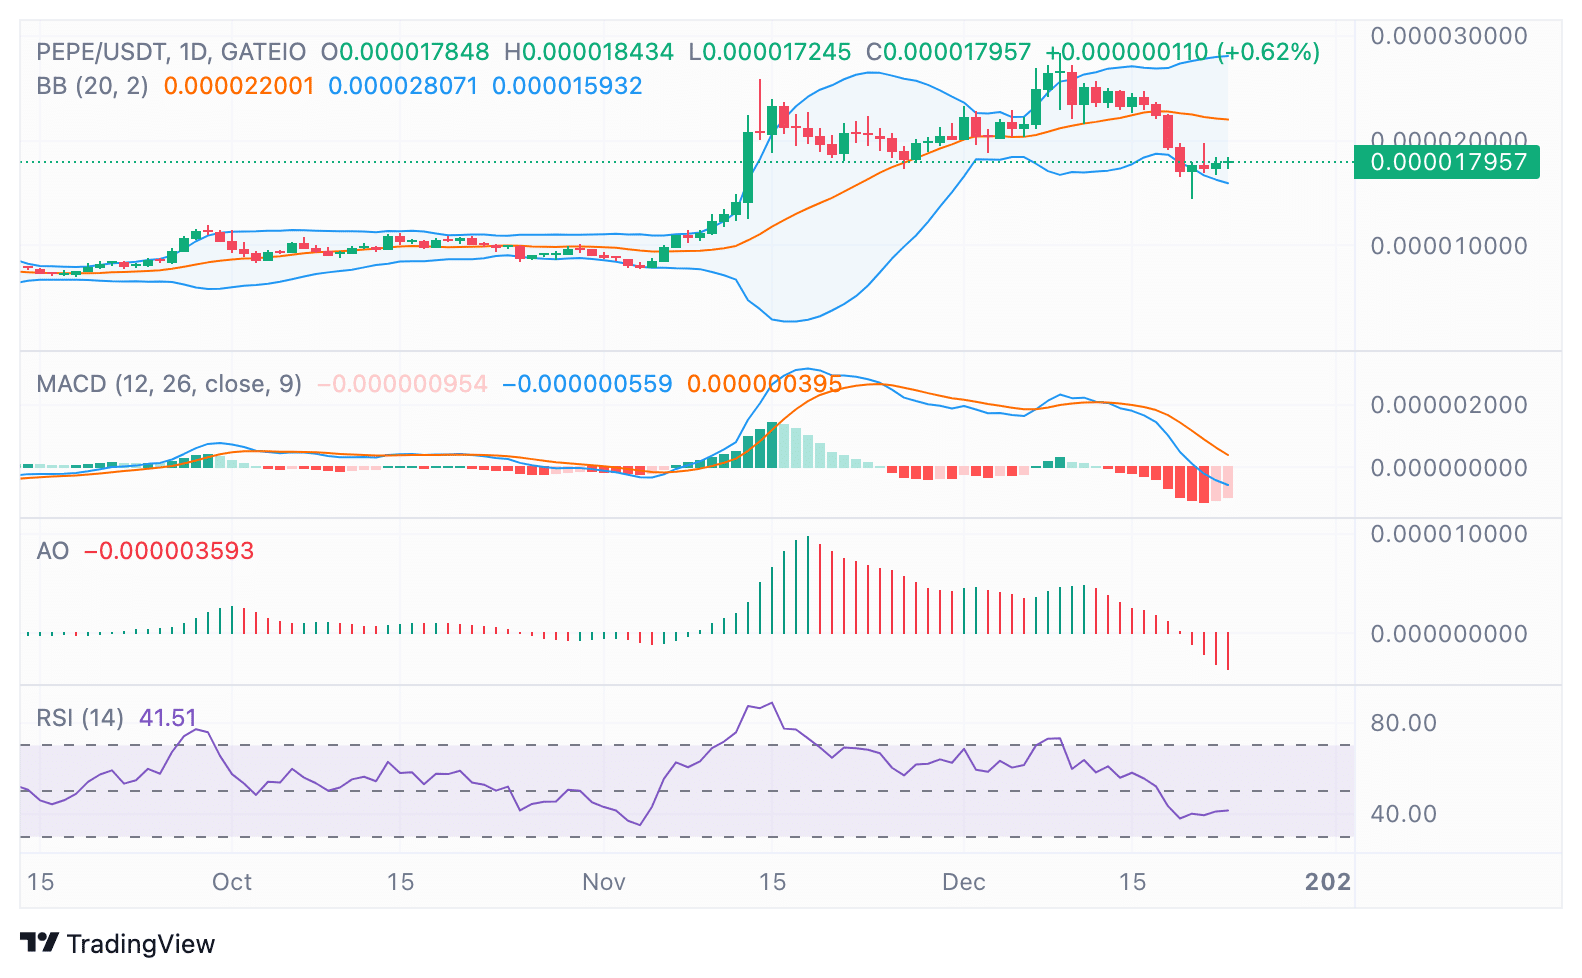
On-chain data provides further insights into PEPE’s potential for price movement. Over 73% of PEPE wallets are currently in profit, with strong support observed between $0.000011 and $0.000013. However, resistance is expected between $0.000019 and $0.000022, where many holders may look to sell and recoup losses. Bollinger Bands confirm these critical levels, with the lower band at $0.00001593 offering support and the upper band at $0.00002201 acting as resistance.
Indicators Point to Weakening Bearish Momentum
Momentum indicators suggest that the bearish trend may be losing steam. The MACD histogram shows signs of contraction, pointing to a potential bullish crossover. Meanwhile, the RSI sits at 41.51, just below neutral, but not in oversold territory—suggesting that a move above 50 could spark renewed buying interest.
As the market stabilizes, the combination of technical signals, on-chain metrics, and price action indicates that PEPE may be positioning itself for a significant move. Traders and analysts alike are watching closely to see if PEPE can break through key resistance levels and begin its next rally.
Disclaimer: The information in this article is for general purposes only and does not constitute financial advice. The author’s views are personal and may not reflect the views of Chain Affairs. Before making any investment decisions, you should always conduct your own research. Chain Affairs is not responsible for any financial losses.
I’m a crypto enthusiast with a background in finance. I’m fascinated by the potential of crypto to disrupt traditional financial systems. I’m always on the lookout for new and innovative projects in the space. I believe that crypto has the potential to create a more equitable and inclusive financial system.