|
Getting your Trinity Audio player ready...
|
Litecoin (LTC) is currently experiencing a strong upward movement, with key technical indicators pointing towards continued bullish momentum. The Relative Strength Index (RSI) has surged into overbought territory, while the Chaikin Money Flow (CMF) is at its highest level in over a month, signaling strong accumulation by investors. This combination suggests that Litecoin could test significant resistance levels in the near future, potentially reaching its highest price in over a month.
RSI Shows Overbought Conditions
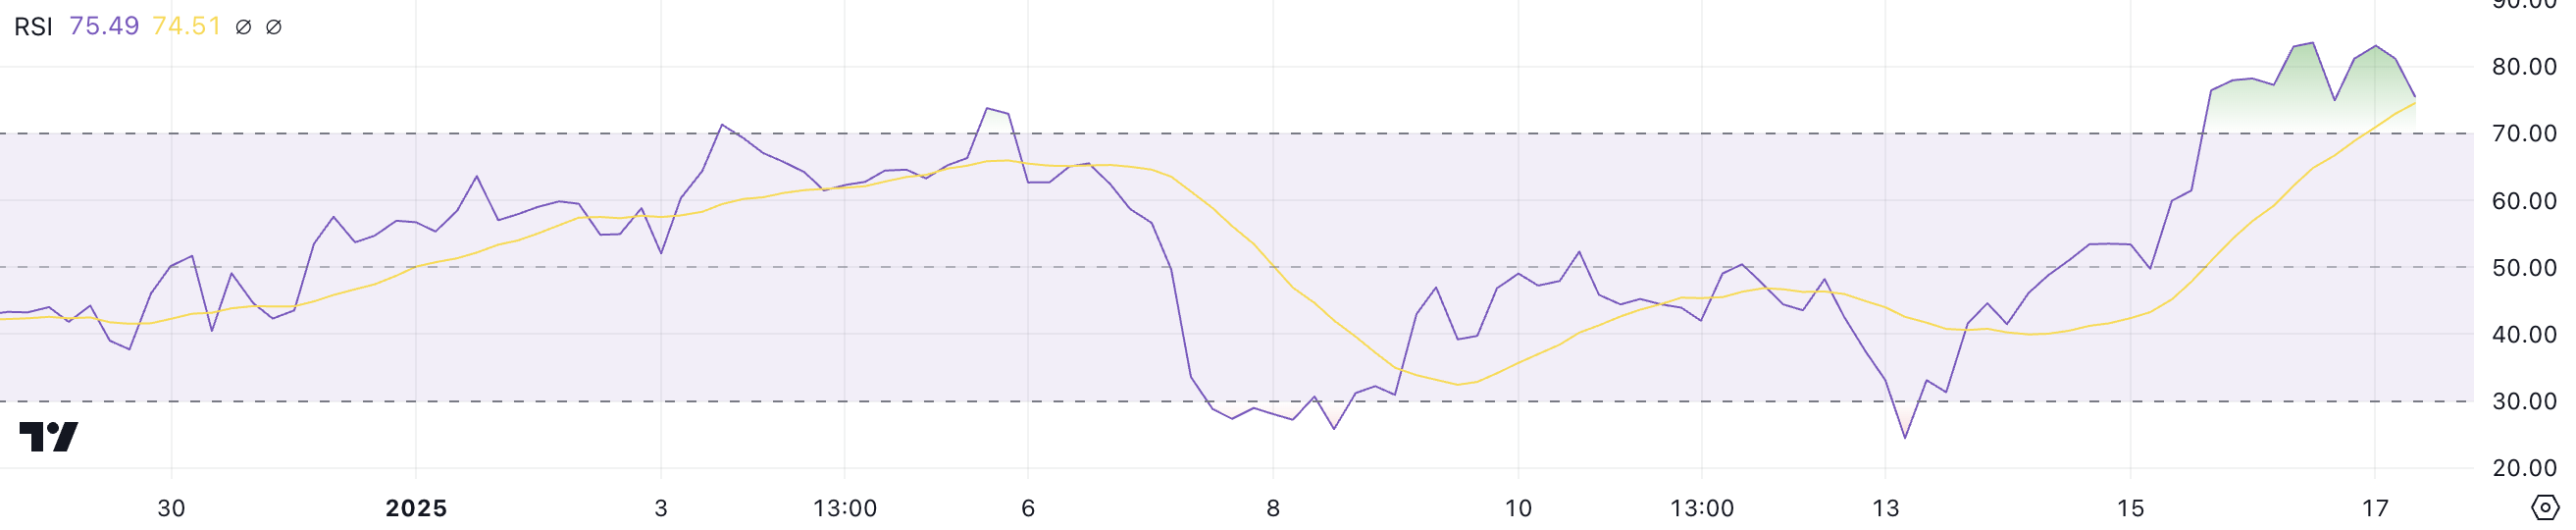
Litecoin’s RSI has risen dramatically, currently sitting at 75.4, up from just 24.4 four days ago. Yesterday, the RSI reached 83.5, marking the highest level since December 3, 2024. An RSI above 70 typically indicates that the asset may be overbought and could be due for a short-term pullback. However, strong bullish trends often keep the RSI elevated for extended periods, which could imply that the upward momentum may continue.
If buying pressure remains high, LTC could push higher before any significant correction takes place. Traders should, however, remain vigilant for any signs of weakening momentum that could trigger a reversal.
CMF Reflects Strong Buying Pressure
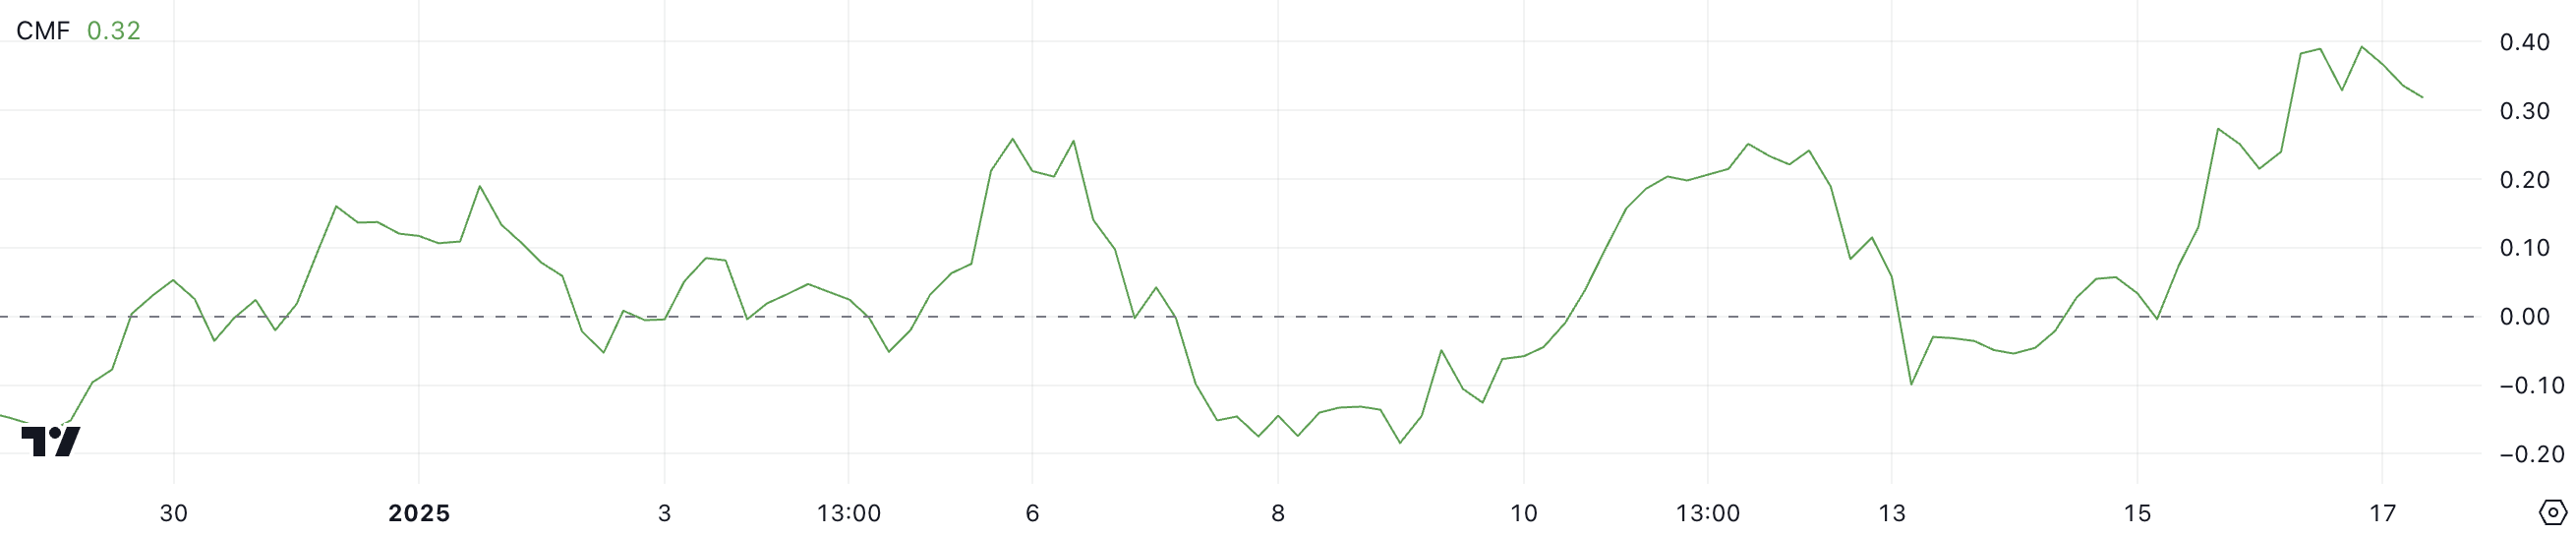
The Chaikin Money Flow for Litecoin has also been impressive, currently sitting at 0.32, a significant increase from -0.1 just days ago. A CMF value above 0 indicates net buying pressure, and a peak of 0.39 reflects strong accumulation. This suggests that investor confidence is robust, which could support further gains in the short term.
Should the CMF decline, it may signal waning buying interest, potentially leading to a cooling-off period for Litecoin’s price.
Price Prediction: Testing Resistance Levels
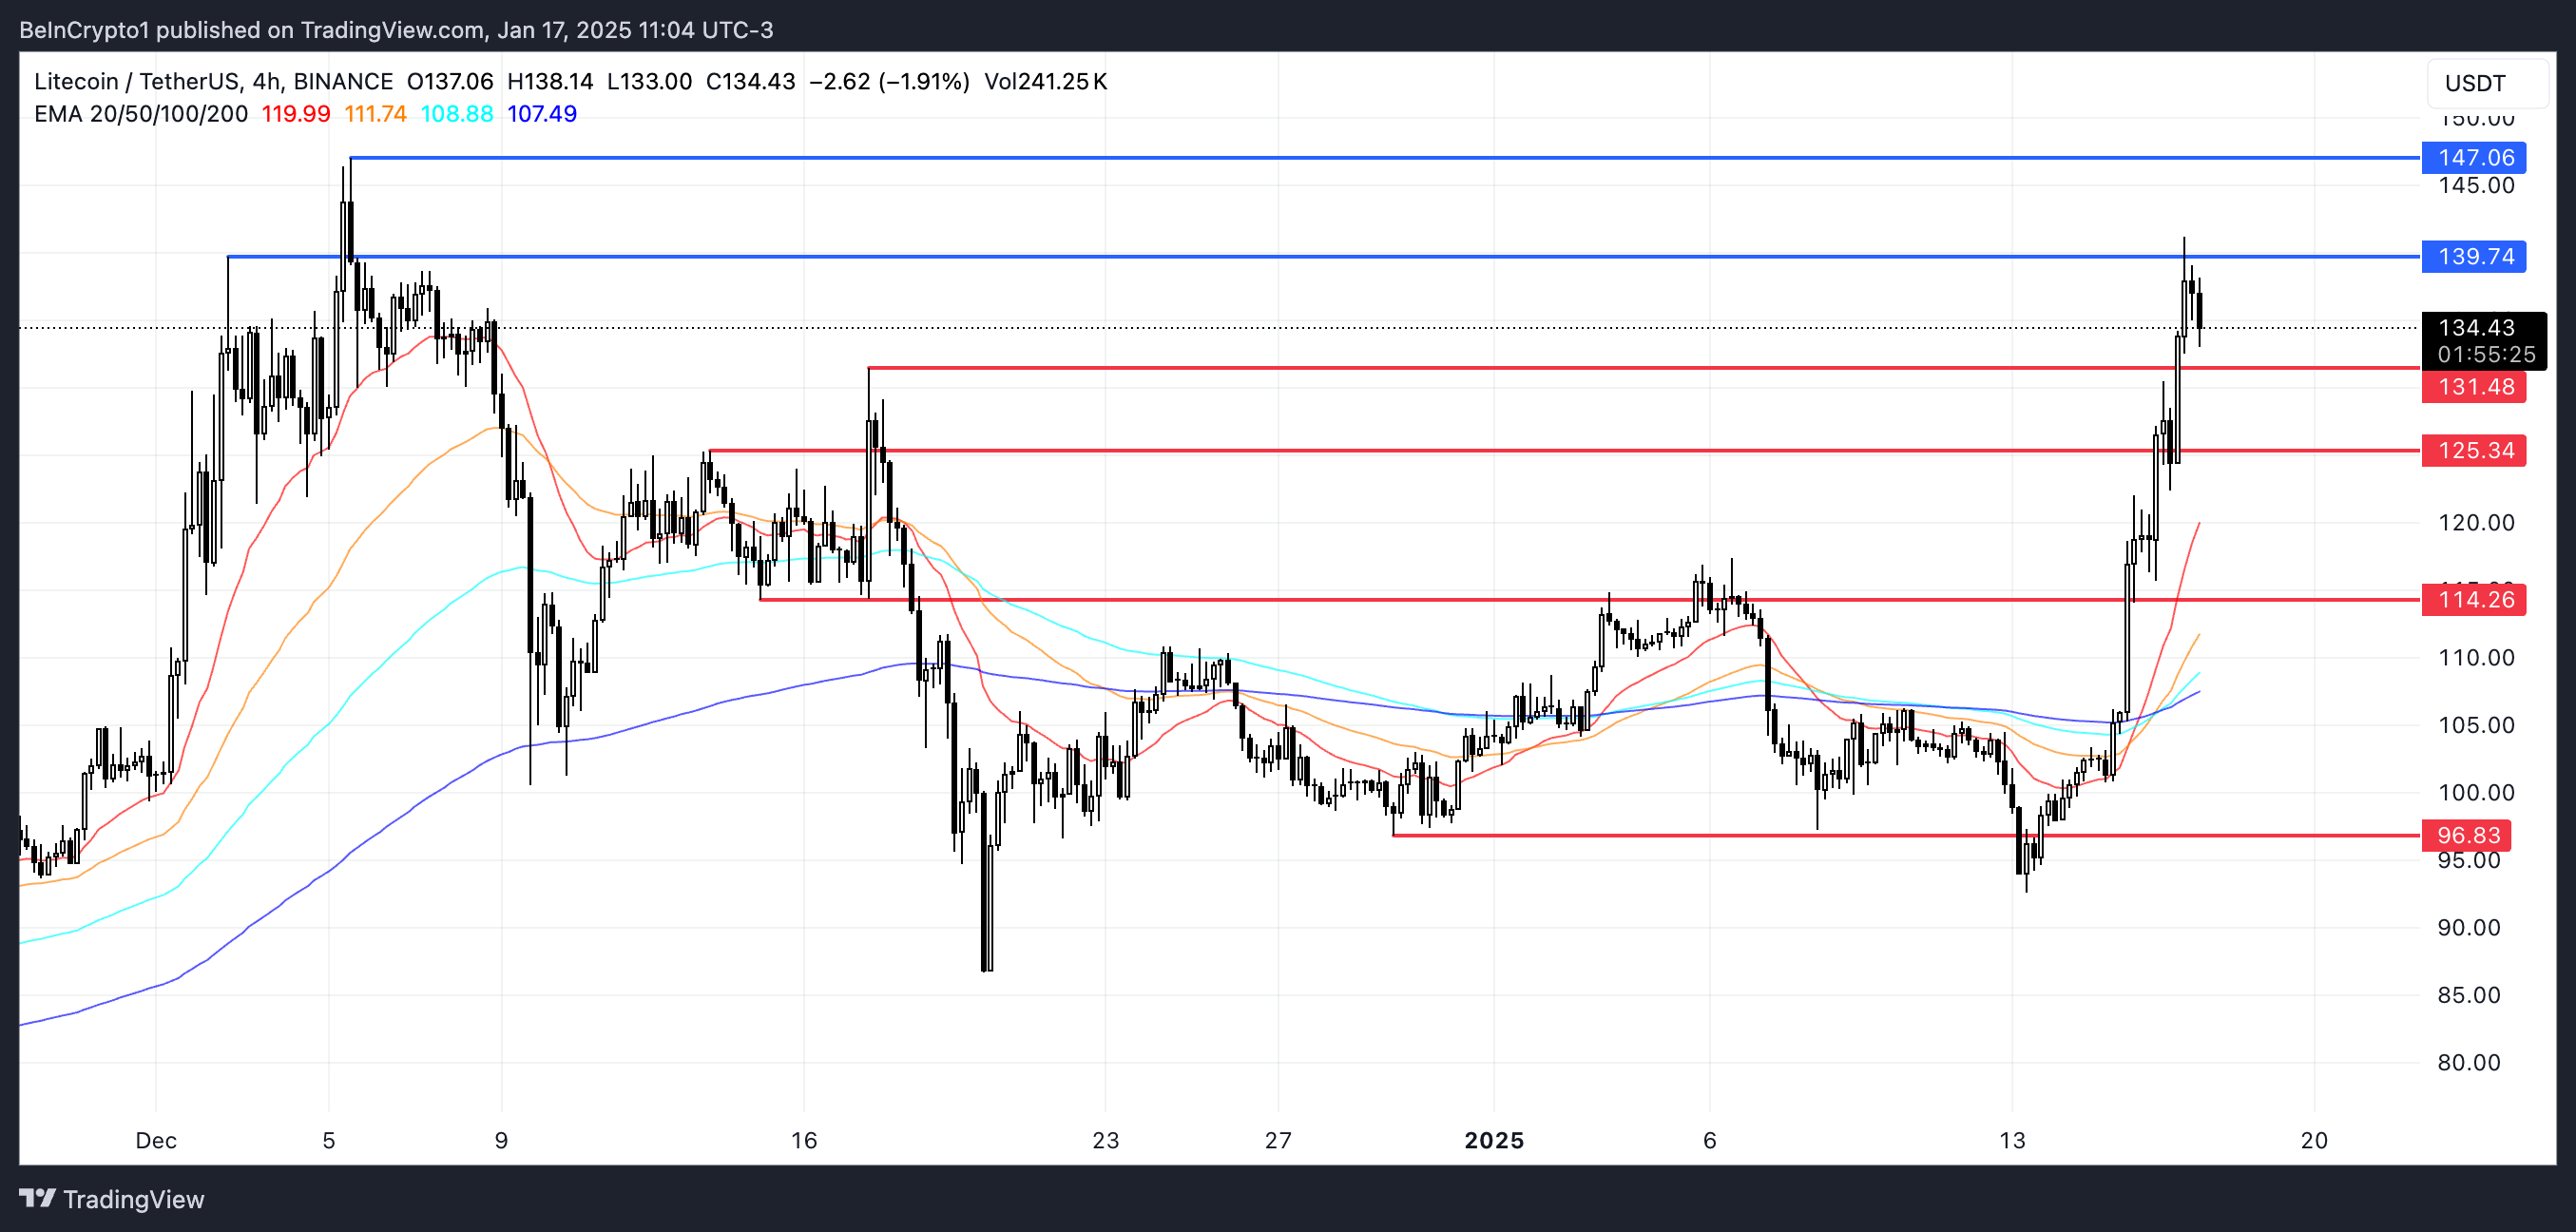
If the current momentum continues, Litecoin could test the key resistance level at $139. A break above this could lead to a potential rally towards $147, marking its highest point since early December 2024. However, if the uptrend stalls, support at $131 will be critical. A failure to hold this level could result in a drop towards $125 or even lower, with a potential correction reaching $114.
Disclaimer: The information in this article is for general purposes only and does not constitute financial advice. The author’s views are personal and may not reflect the views of Chain Affairs. Before making any investment decisions, you should always conduct your own research. Chain Affairs is not responsible for any financial losses.
Also Read: Litecoin Surges Above $118: Whale Accumulation and ETF Optimism Fuel Bullish Momentum
I’m a crypto enthusiast with a background in finance. I’m fascinated by the potential of crypto to disrupt traditional financial systems. I’m always on the lookout for new and innovative projects in the space. I believe that crypto has the potential to create a more equitable and inclusive financial system.