|
Getting your Trinity Audio player ready...
|
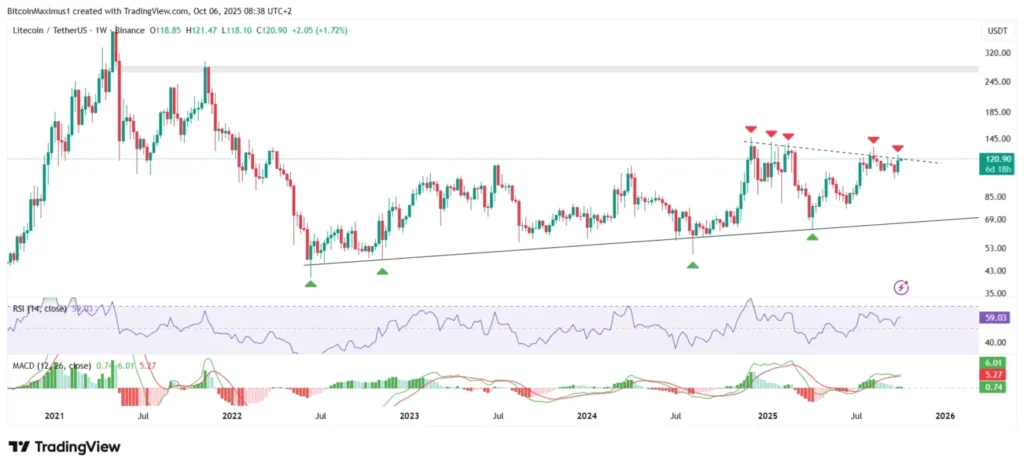
- LTC is testing a key resistance line that capped prices for nearly a year.
- Momentum and wave analysis suggest a potential parabolic move toward $275.
- Long-term charts indicate this could be the start of a multi-wave rally leading to new all-time highs.
Stay ahead with real-time updates and insights—Join our Telegram channel!
Litecoin (LTC) is capturing attention as bulls attempt to break a key resistance that has contained the price for nearly a year. Following a strong bounce from long-term support in April, the crypto now stands at a crucial juncture. A successful breakout could trigger a sharp upward move, with projections pointing toward $275.
LTC Price Sets Up for Breakout
Since rebounding from the long-term ascending support trend line, Litecoin has steadily climbed. However, a diagonal resistance line has repeatedly blocked its path, stalling upward momentum. The latest attempt shows promise, with momentum indicators such as RSI and MACD turning bullish, signaling that LTC may finally overcome this barrier.
Traders are watching closely, as a breakout from this trend line could create a parabolic surge. Historically, Litecoin faces minimal overhead resistance beyond this level, suggesting that rapid gains are possible if buyers continue to dominate.
Daily Analysis Supports Uptrend
Shorter time frames reinforce the bullish outlook. Technical analysis indicates that Litecoin has completed an A-B-C correction near the $99 Fibonacci retracement level, bouncing impulsively since then. This pattern hints at the start of a new five-wave upward movement, with an initial target of $172 before a potential retracement.
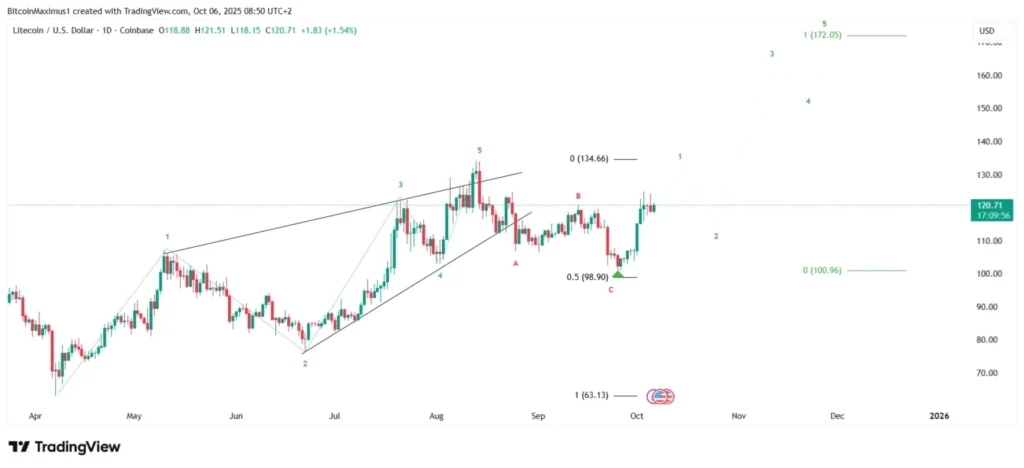
The daily wave count aligns with broader weekly trends, giving traders confidence that Litecoin’s correction phase may be over. If the current momentum persists, LTC could accelerate toward higher levels rapidly.
Also Read: Litecoin Breaks $112 Resistance as Futures Surge $100M—Is $135 Next?
Long-Term Outlook Remains Strong
Looking further ahead, Litecoin appears to have completed a seven-year symmetrical triangle correction. This sets the stage for a larger five-wave rally, suggesting that the projected $275 high could merely be the third wave of a much larger upward trajectory. Optimistic projections indicate that LTC may reach a new all-time high during the early months of 2026 if the wave structure plays out.
Litecoin’s chart shows multiple bullish signals across different time frames. The key resistance breakout could unleash a parabolic rally, and long-term wave counts point to even higher targets. Traders and investors may want to watch LTC closely as the market positions for a potential surge.
Stay ahead with real-time updates and insights—Join our Telegram channel!
Disclaimer: The information in this article is for general purposes only and does not constitute financial advice. The author’s views are personal and may not reflect the views of Chain Affairs. Before making any investment decisions, you should always conduct your own research. Chain Affairs is not responsible for any financial losses.
I’m a crypto enthusiast with a background in finance. I’m fascinated by the potential of crypto to disrupt traditional financial systems. I’m always on the lookout for new and innovative projects in the space. I believe that crypto has the potential to create a more equitable and inclusive financial system.