|
Getting your Trinity Audio player ready...
|
Key Takeaways:
- HBAR is testing the $0.22 support, a crucial level defined by its 20-day EMA.
- Positive funding rates and strong futures demand suggest underlying bullish sentiment.
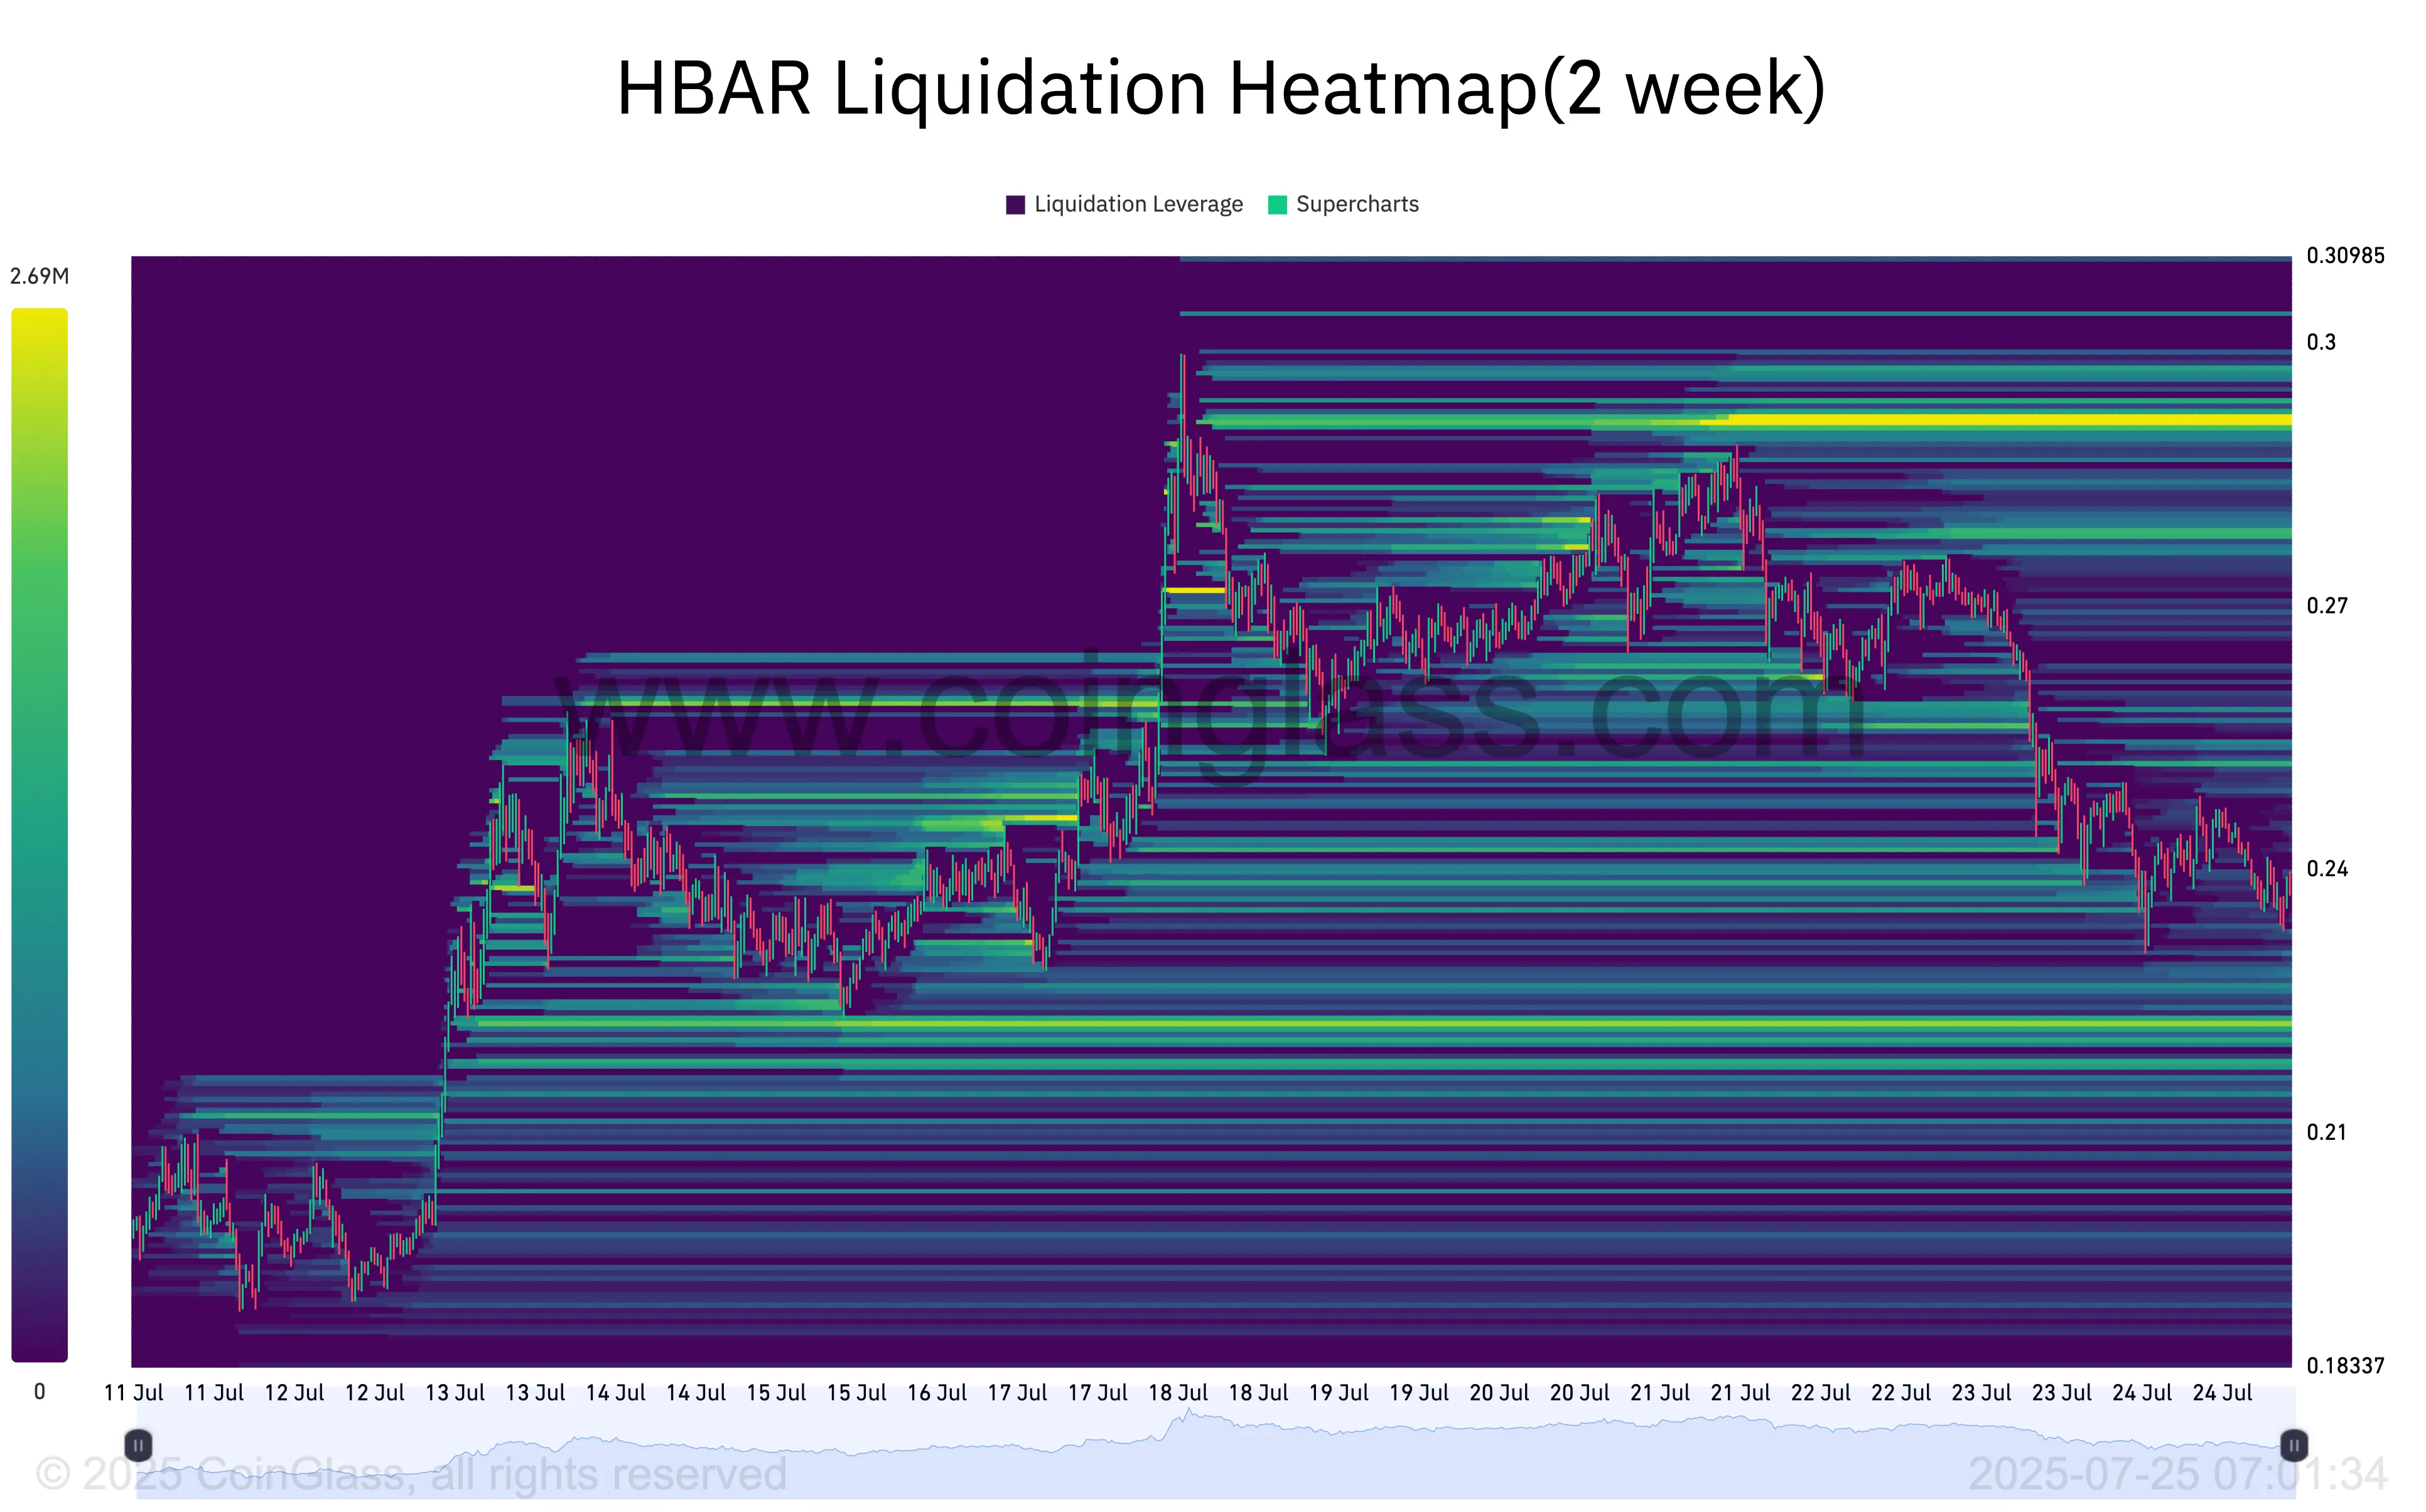
- A liquidity cluster at $0.29 could act as a short-term price target if bulls defend support successfully.
Hedera’s native token HBAR is on thin ice, hovering just above a crucial technical level on its daily chart. With downside pressure mounting, a breakdown appears increasingly likely. However, not all indicators are flashing red—on-chain data reveals encouraging signs that could pave the way for a bullish reversal.
HBAR Tests 20-Day EMA as Support Weakens
On the daily timeframe, HBAR is trading precariously close to its 20-day exponential moving average (EMA), which currently sits at the $0.22 mark. This EMA is a widely used trend-following indicator that emphasizes recent price movements to gauge short-term momentum.
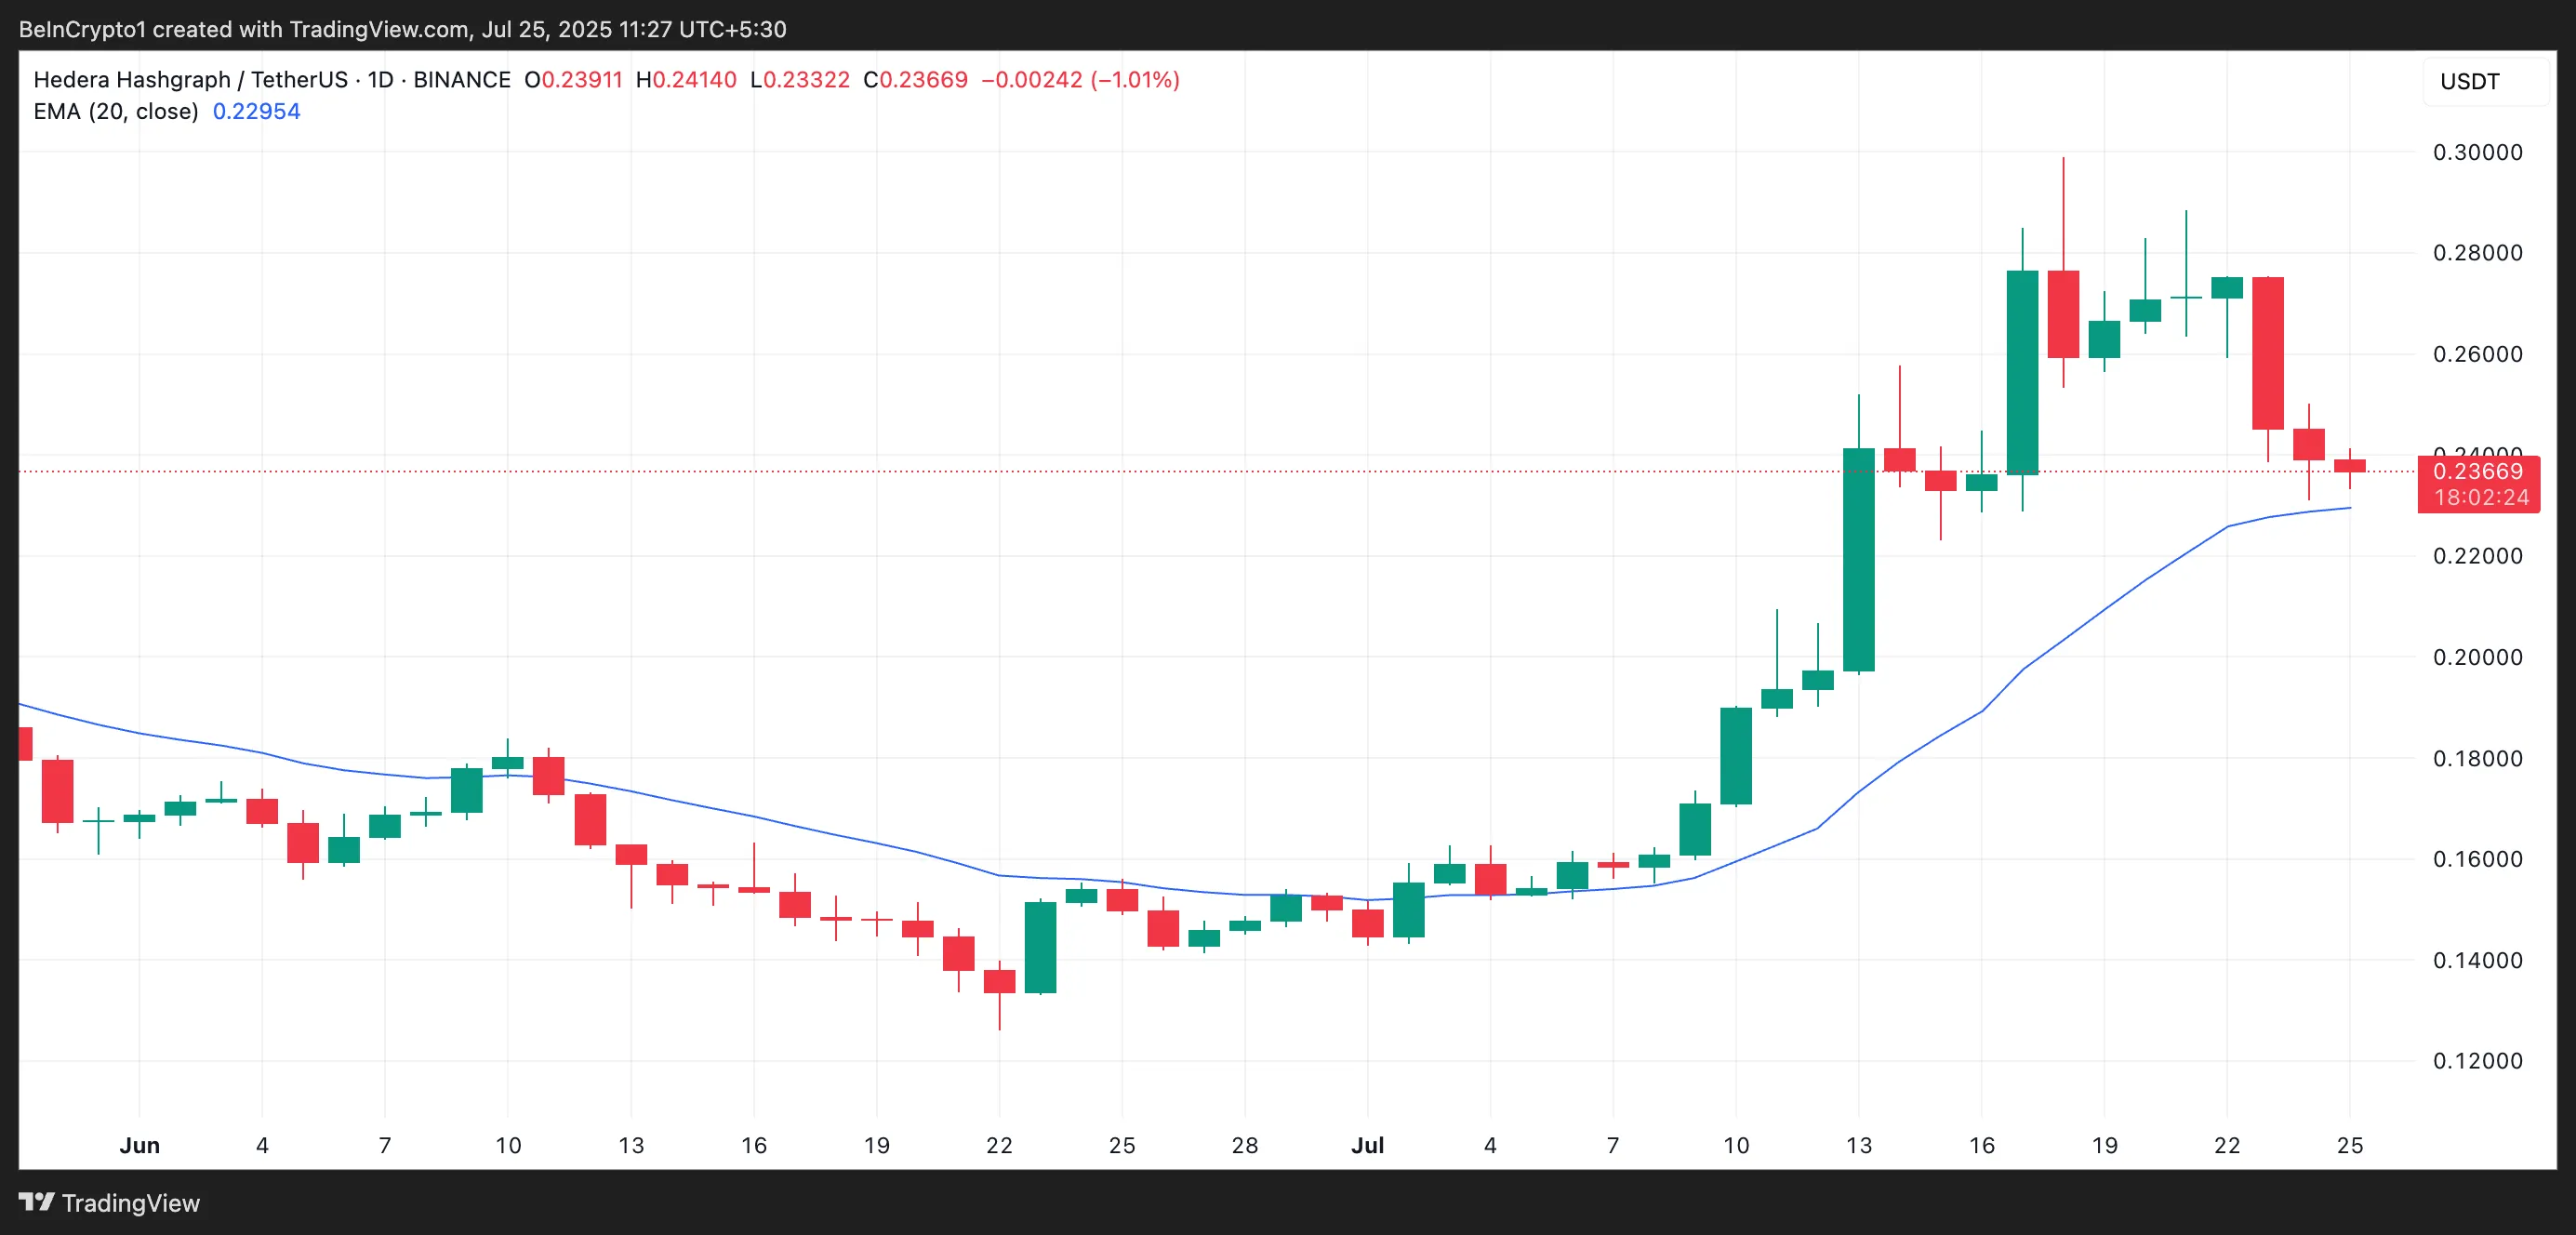
A clean break below this level, especially after weeks of climbing price action, would signal fading bullish momentum and could trigger further selling. Traders often interpret this type of breach as a shift in sentiment from bullish to bearish, increasing the likelihood of a deeper correction.
Positive Funding Rate Signals Lingering Bullish Sentiment
Despite the looming threat of breakdown, derivatives data paints a more optimistic picture. As of July 25, HBAR’s funding rate remains positive at 0.0092%, according to Coinglass. This rate reflects the ongoing willingness of long-position traders to pay shorts to maintain their leverage.
A sustained positive funding rate suggests that market participants still expect upward price movement. Even while spot prices have lagged, this bullish positioning in futures markets could act as a foundation for a relief rally—provided market conditions stabilize.
$0.29 Liquidity Cluster Could Attract Price Action
Adding to the bullish case is HBAR’s liquidation heatmap, which highlights a concentrated cluster of potential liquidations around the $0.29 price level. These liquidity zones tend to act as magnets for price action, especially in sideways or slightly bullish markets.
With this target zone located above current levels, traders may begin pushing HBAR upward in a bid to trigger liquidations, thereby amplifying short-term buying pressure. If the support at $0.22 holds, the $0.26–$0.29 zone could be a logical next destination.
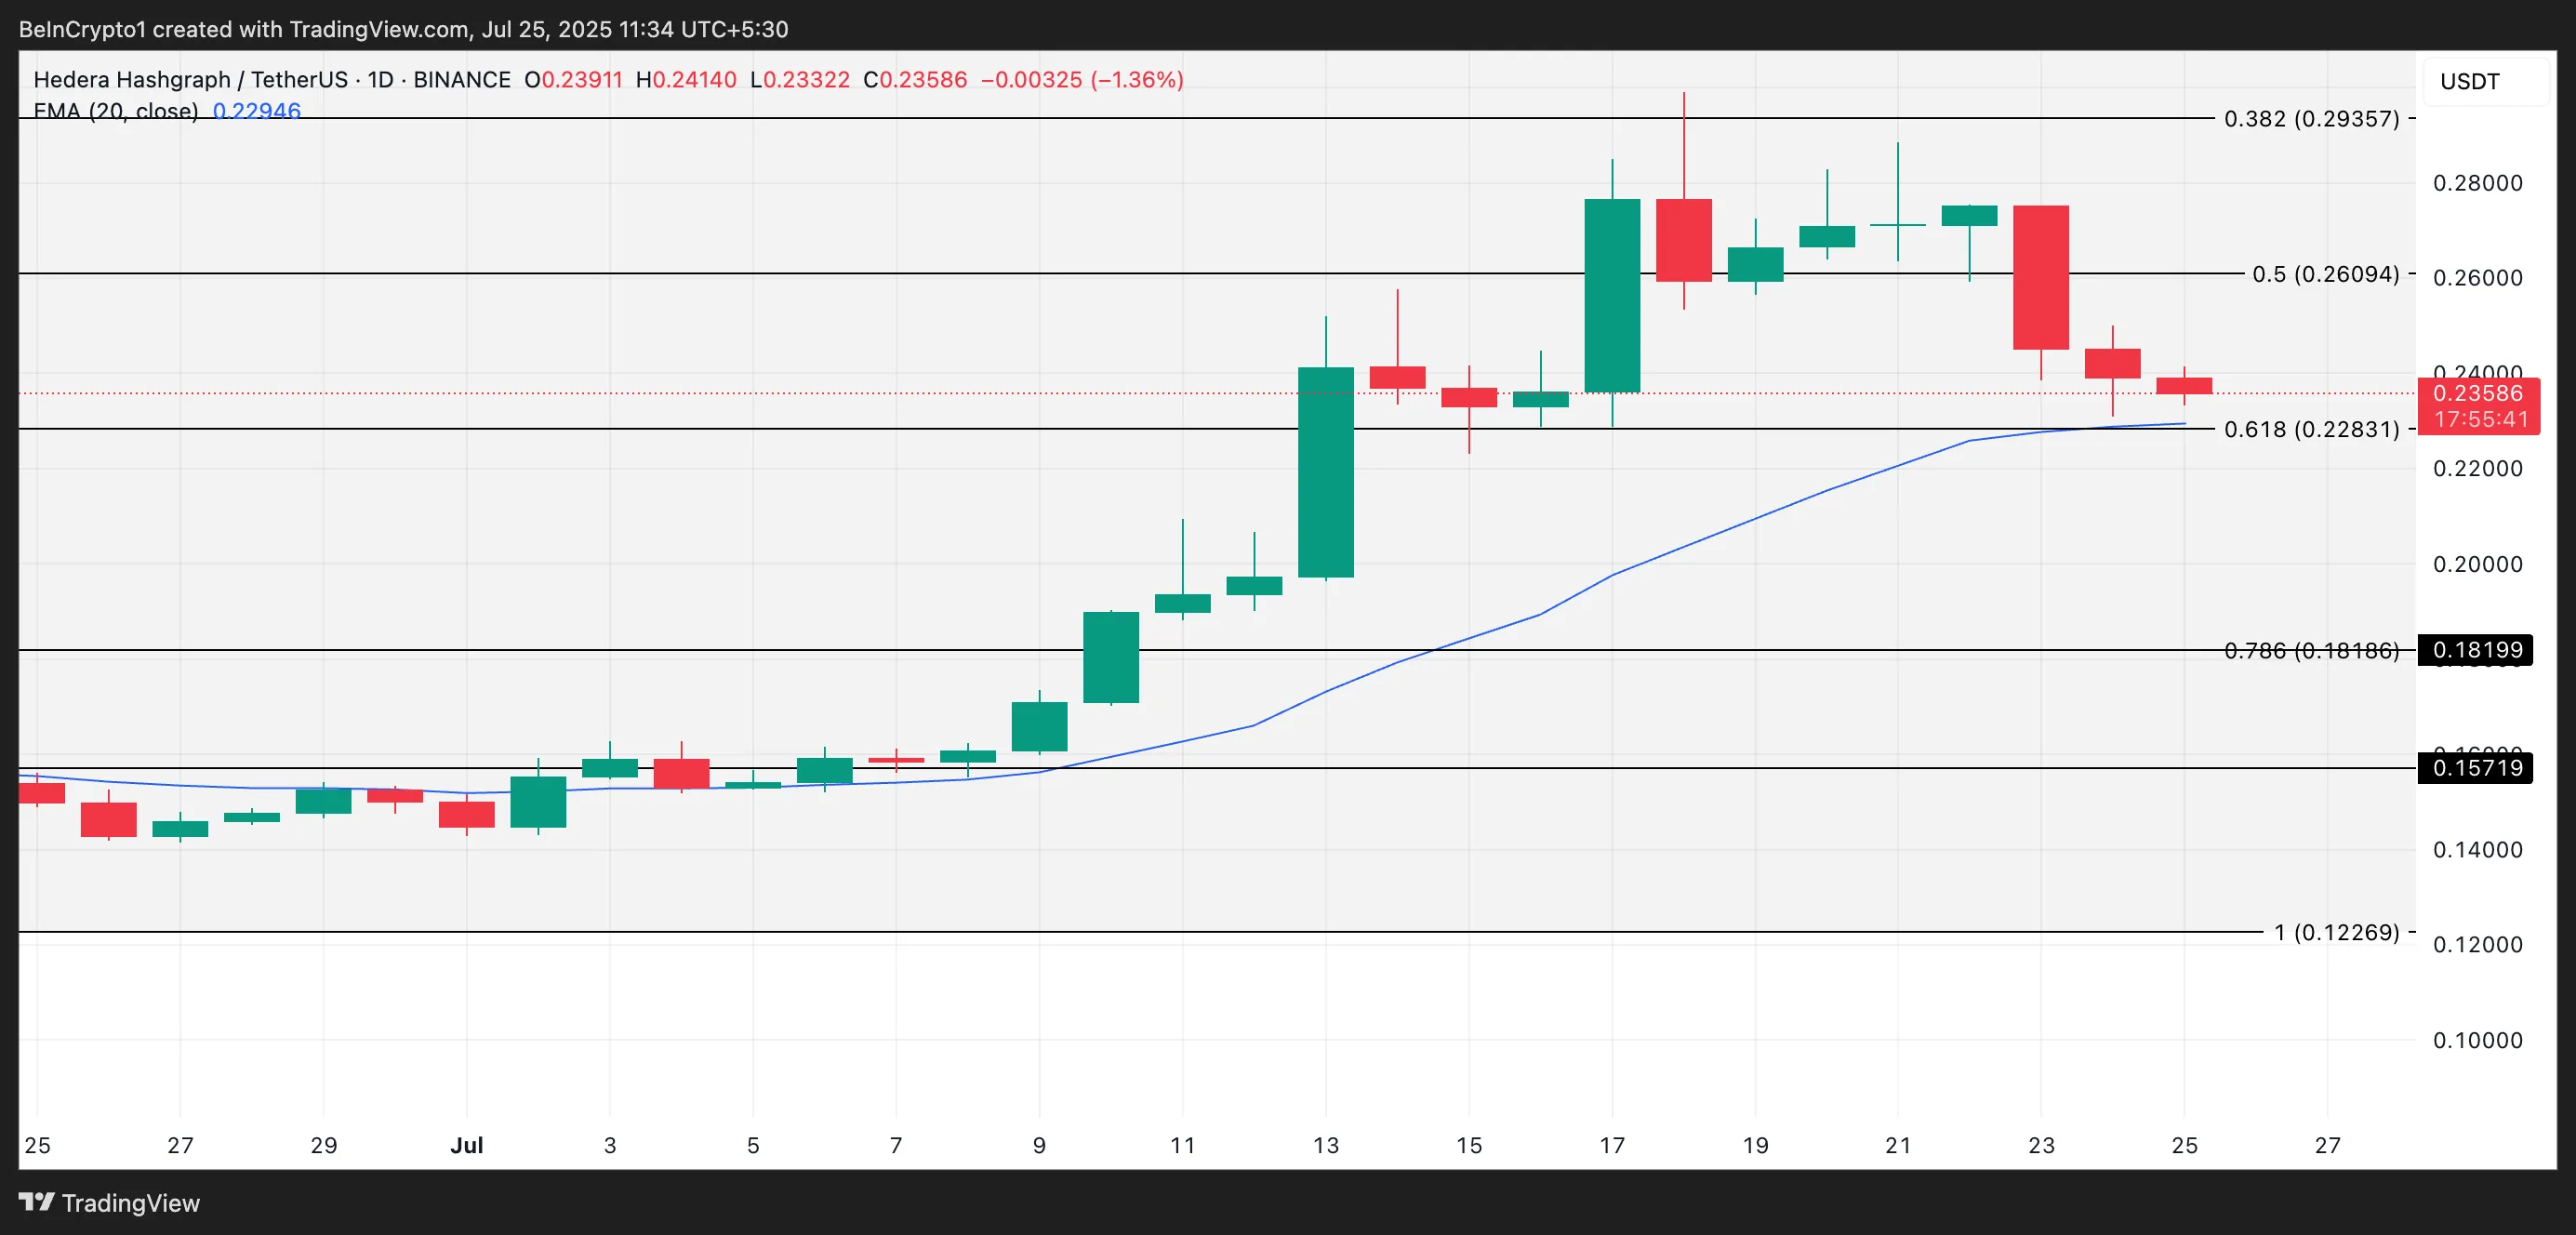
HBAR’s price is at a critical crossroads. A breakdown below the 20-day EMA support at $0.22 could open the door to deeper losses, with $0.18 as a potential next stop. However, bullish signs—including a positive funding rate and an attractive liquidity cluster at $0.29—suggest a reversal isn’t out of the question.
Disclaimer: The information in this article is for general purposes only and does not constitute financial advice. The author’s views are personal and may not reflect the views of Chain Affairs. Before making any investment decisions, you should always conduct your own research. Chain Affairs is not responsible for any financial losses
Also Read: Hedera (HBAR) Surges 125% — Will It Follow XRP to a New All-Time High?
I’m a crypto enthusiast with a background in finance. I’m fascinated by the potential of crypto to disrupt traditional financial systems. I’m always on the lookout for new and innovative projects in the space. I believe that crypto has the potential to create a more equitable and inclusive financial system.