|
Getting your Trinity Audio player ready...
|
Hedera (HBAR) has been in a downtrend recently, but signs are emerging that this bearish momentum may be weakening. The Average Directional Index (ADX) is showing that the ongoing downtrend is losing strength, while the Ichimoku Cloud remains firmly bearish, suggesting that sellers are still in control for now.
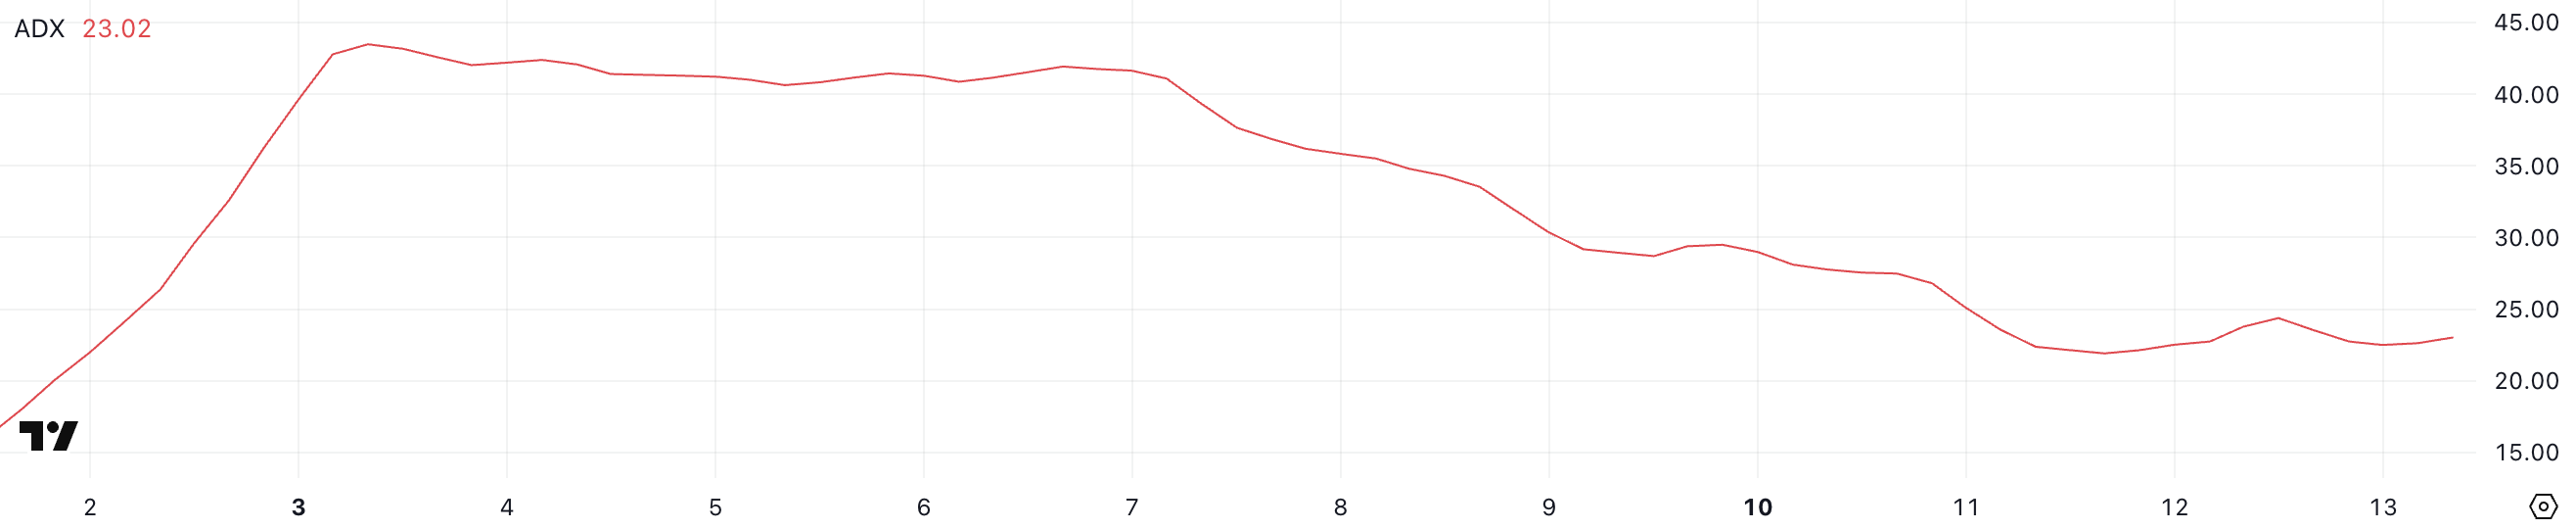
Currently, HBAR’s ADX sits at 23, a noticeable decline from 28.9 three days ago. This drop indicates that the strength of the current trend is weakening, with selling pressure losing momentum. ADX, which measures the strength of a trend rather than its direction, signals that while the downtrend persists, it is not as intense as before. Values below 20 represent weak trends, while values above 25 suggest strong, sustained movement. HBAR’s ADX at 23 suggests that while the downtrend remains intact, its strength is diminishing. If the ADX continues to decline, the price action may shift into a consolidation phase instead of further declines, though the trend reversal is not guaranteed without stronger buying pressure.
On the other hand, the Ichimoku Cloud chart presents a bearish setup, with HBAR price action consistently below the cloud. The red cloud indicates bearish momentum, and attempts to break above it have been rejected. The Tenkan-sen (blue line) is below the Kijun-sen (red line), reinforcing the prevailing weakness. The Senkou Span A (green line) remains below the Senkou Span B (red line), signaling continued downward pressure. While the bearish setup is still intact, the narrowing distance between the two spans may suggest a potential change if buying momentum strengthens.
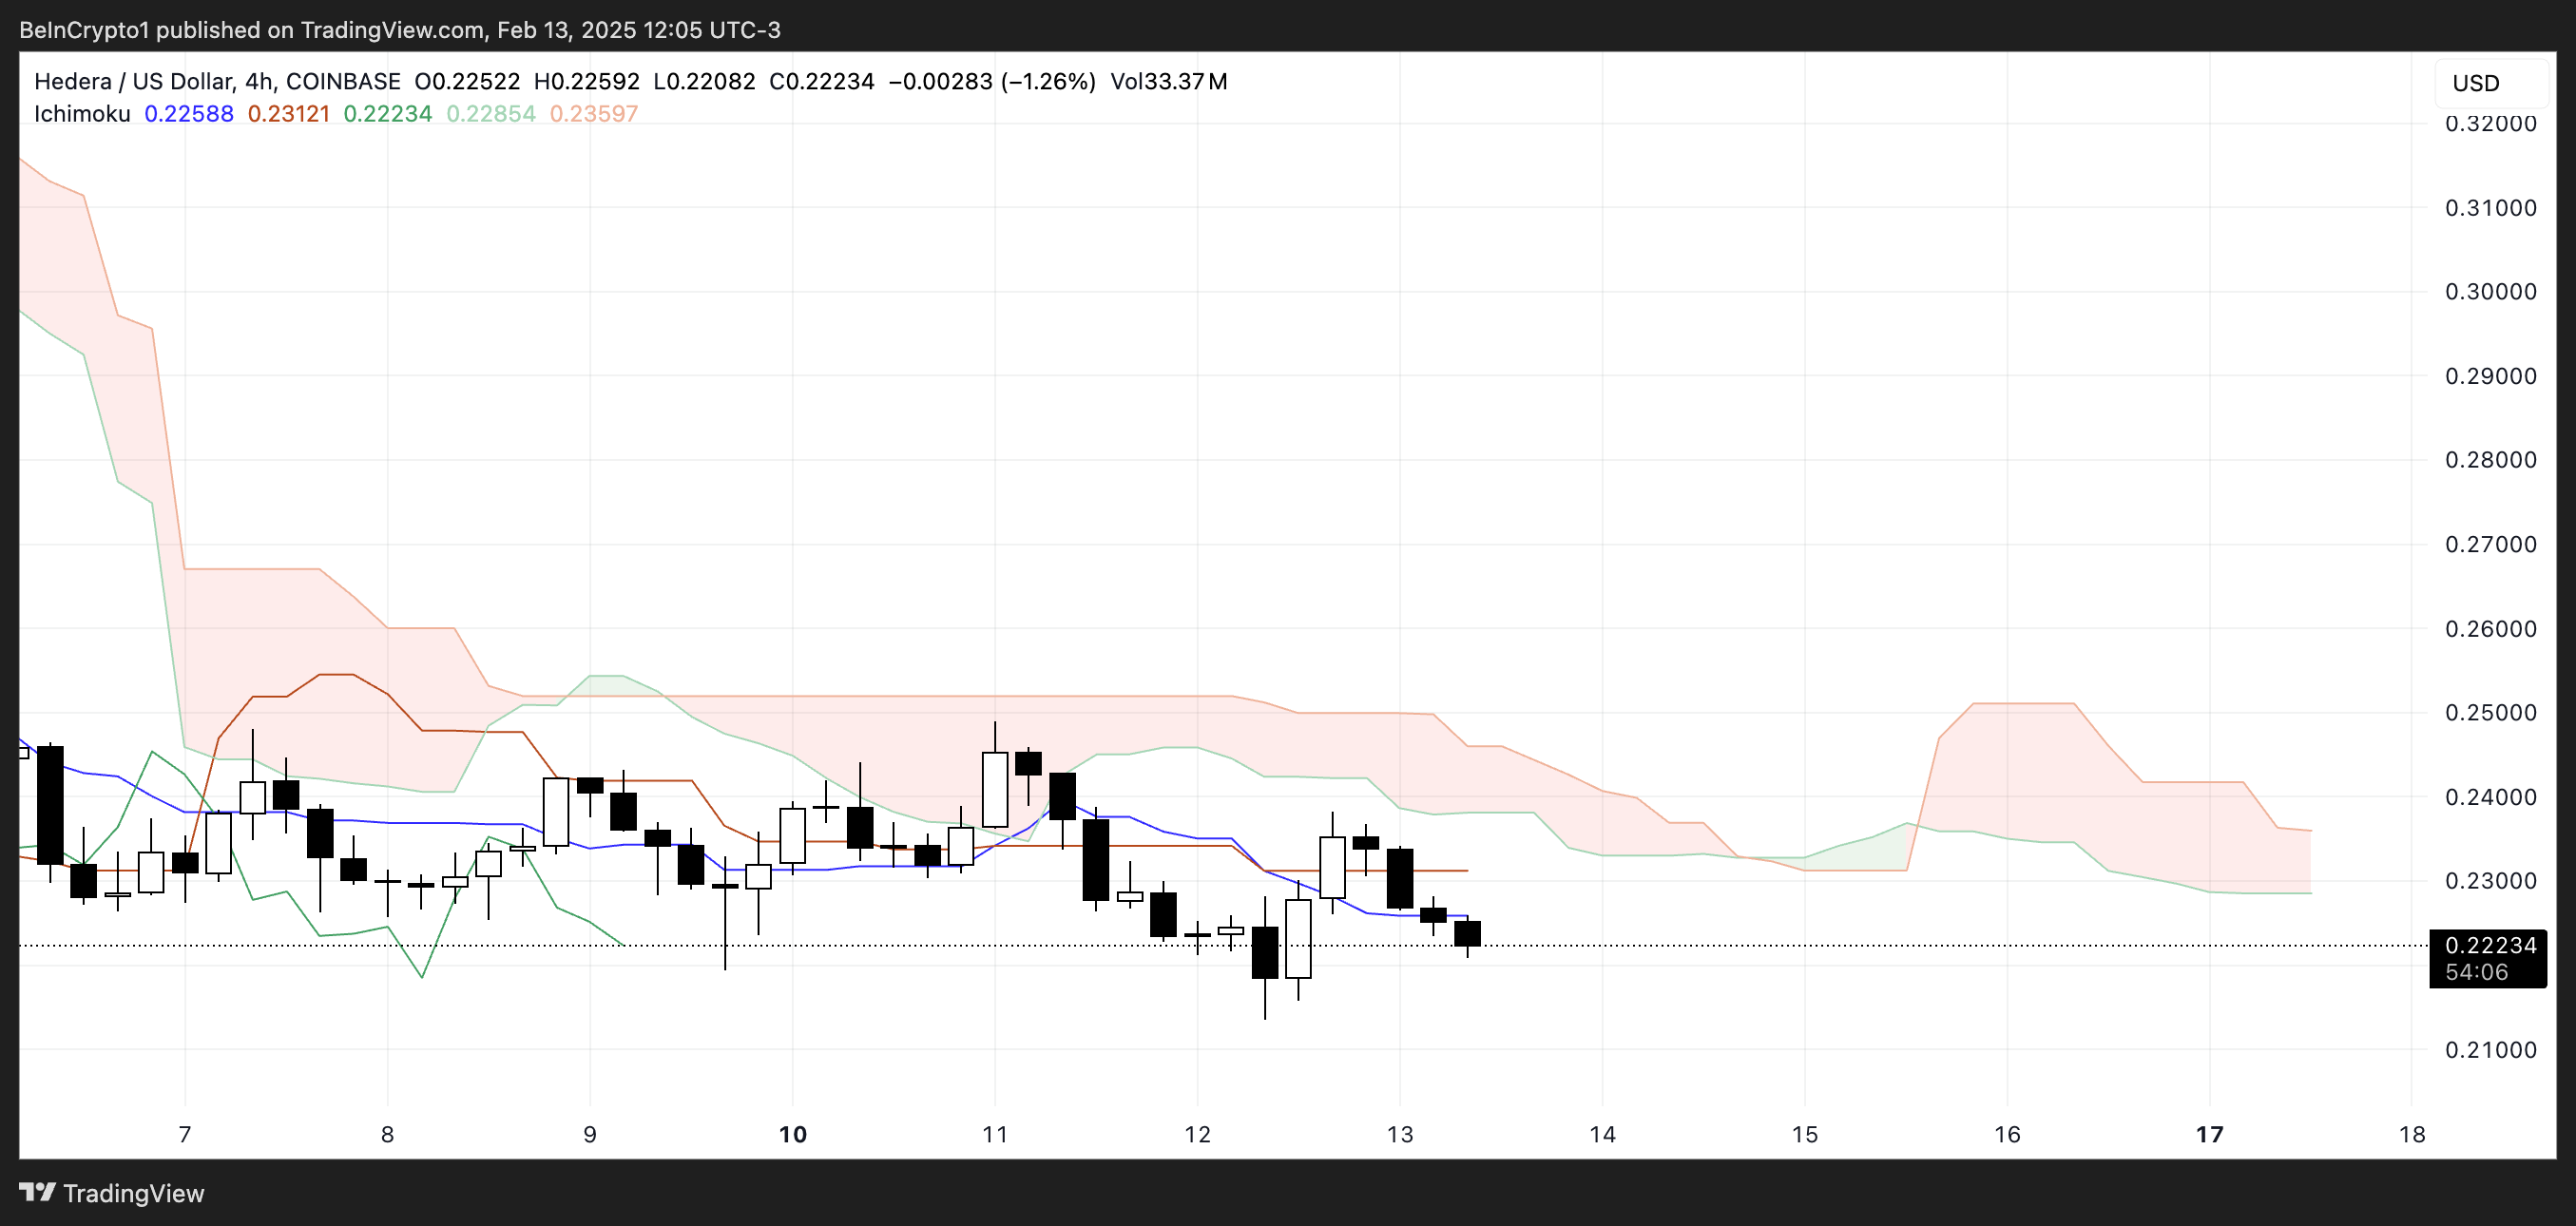
For HBAR to reverse its downtrend, buyers need to step in with conviction. A strong recovery above key resistance levels could shift momentum. The immediate resistance lies at $0.248, and a breakout could lead to further gains, with potential to reach $0.32, marking a 46% upside. However, without sustained bullish momentum, HBAR may continue to face downward pressure, with support at $0.179 potentially being tested.
Also Read: Cardano vs Hedera: Which Blockchain Will Lead the Price Rebound in 2025?
HBAR’s future is uncertain, but with a careful watch on key levels and indicators, traders can anticipate whether a breakout or further declines are imminent.
Disclaimer: The information in this article is for general purposes only and does not constitute financial advice. The author’s views are personal and may not reflect the views of Chain Affairs. Before making any investment decisions, you should always conduct your own research. Chain Affairs is not responsible for any financial losses.
I’m a crypto enthusiast with a background in finance. I’m fascinated by the potential of crypto to disrupt traditional financial systems. I’m always on the lookout for new and innovative projects in the space. I believe that crypto has the potential to create a more equitable and inclusive financial system.