|
Getting your Trinity Audio player ready...
|
Floki Inu (FLOKI) has seen a dramatic decline in recent weeks, raising questions about its future price trajectory. This analysis delves into the technical indicators shaping FLOKI’s price movements and explores potential support and resistance levels.
Daily Chart Breakdown: Critical Support Levels Tested
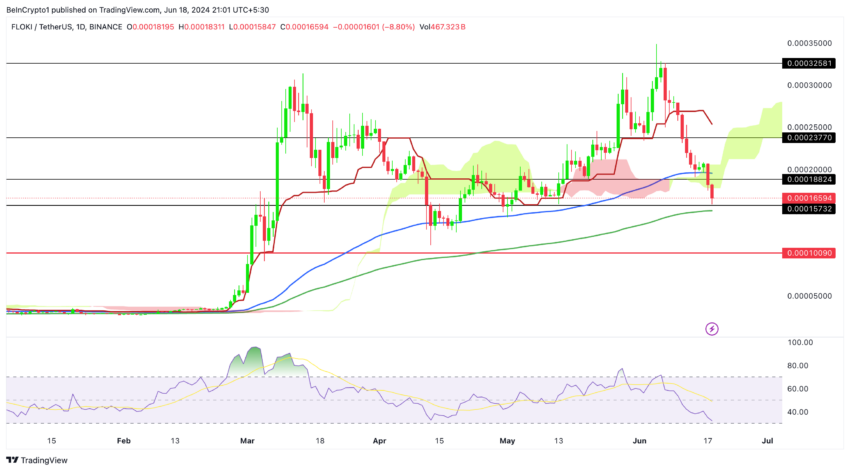
The daily chart reveals significant volatility following FLOKI’s all-time high of $0.00035. A 54% drop since early June highlights the influence of several technical factors. Our previous analysis anticipated a potential decline if key support levels were breached.

The breakdown below the Ichimoku Cloud’s dark red baseline on June 7 marked a shift in market sentiment and triggered further losses. Currently, the price is testing the crucial 200 EMA (green line). A break below this level could lead to increased volatility and a possible drop towards $0.00015.
Immediate support zones to watch include $0.000165 and $0.000157. If these fail to hold, the next critical support sits at $0.00010. On the flip side, reclaiming $0.000188 is essential for any significant bullish reversal.
Zooming In: 4-Hour Chart Highlights Bearish Momentum
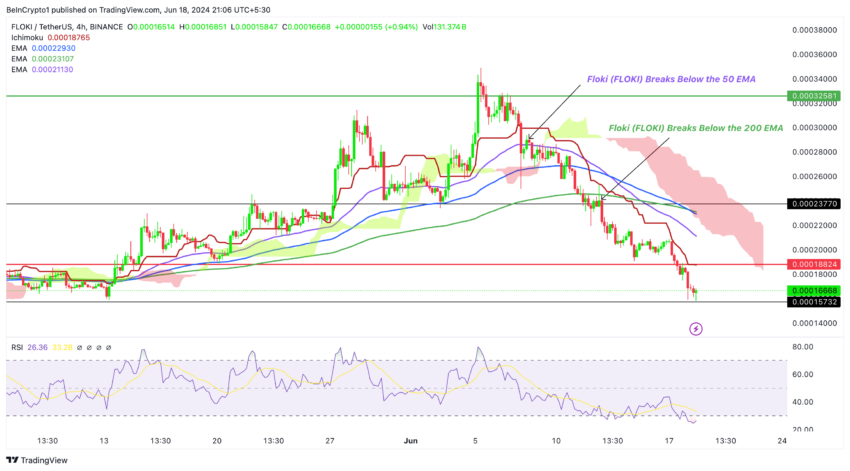
The 4-hour chart offers a closer look at FLOKI’s recent price action, emphasizing key technical patterns and potential reversal points. As predicted in our earlier analysis, the prior break below the 50 EMA on the 4-hour chart at $0.00032 proved to be a major bearish signal.

The red baseline of the 4-hour Ichimoku Cloud now acts as a formidable resistance level. The price’s inability to break above it reinforces the downward pressure. The breakdown below the 50, 100, and 200 EMAs on this timeframe further strengthens the bearish outlook. Additionally, the Ichimoku Cloud itself sits above the price, indicating strong bearish momentum.
Oversold RSI: Potential Reversal or Short-Term Dip?
Both the daily and 4-hour charts show the RSI hovering in oversold territory, suggesting the selling pressure might be nearing exhaustion. However, an oversold RSI alone doesn’t guarantee a reversal; confirmation from other indicators is crucial.
Strategic Recommendations: Navigating the Bearish Landscape
The breach of critical support levels, coupled with price movement below the Ichimoku Cloud on both charts, paints a bearish picture. Social media and trading forums reflect a cautious approach, with many adopting a wait-and-see strategy.
For a meaningful bullish reversal, FLOKI needs to reclaim $0.000188, which coincides with the flattening baseline of the 4-hour Ichimoku Cloud. A sustained break above this level could trigger a shift in sentiment and a potential rally towards $0.000237 and beyond.
Also Read: Floki Inu Bot Prepares for Takeoff: Beta Test Complete, Feature-Rich Tool Aims to Empower Traders
Short-term traders should consider adjusting stop-loss levels to manage risks. If the price finds support around current levels, there might be bounce-back opportunities.
Long-term investors are advised to consider the broader market context and macroeconomic factors before making significant investment decisions. Given the current volatility, waiting for clearer signs of a trend reversal might be prudent before increasing exposure.
Disclaimer: The information in this article is for general purposes only and does not constitute financial advice. The author’s views are personal and may not reflect the views of Chain Affairs. Before making any investment decisions, you should always conduct your own research. Chain Affairs is not responsible for any financial losses.
I’m your translator between the financial Old World and the new frontier of crypto. After a career demystifying economics and markets, I enjoy elucidating crypto – from investment risks to earth-shaking potential. Let’s explore!


