|
Getting your Trinity Audio player ready...
|
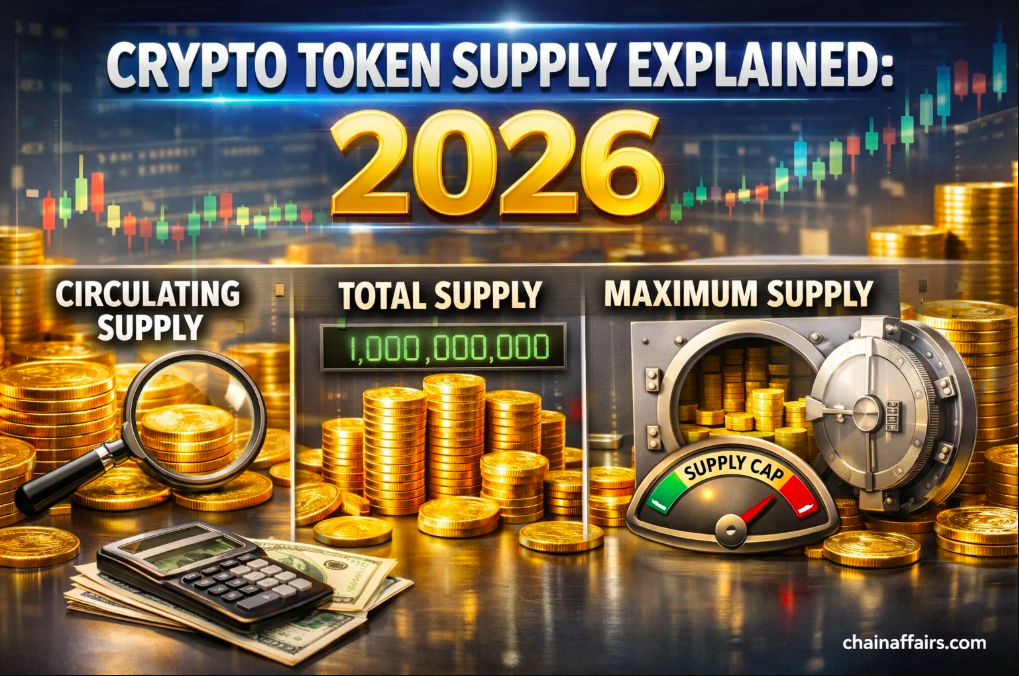
TL;DR: Crypto token supply comes down to four numbers every investor needs to know: circulating supply (what's tradable now), total supply (including locked tokens), maximum supply (the absolute cap), and FDV (what the project would be worth if every token were in circulation today).

Together these metrics reveal whether a token is genuinely scarce or quietly inflationary, how much insider selling pressure is coming, and whether a low price tag masks a bloated valuation. With $155 billion in token unlocks scheduled between 2024 and 2030, understanding supply mechanics isn't optional — it's the first thing to check before investing in any crypto asset.
Understanding crypto token supply is one of the most important skills any investor or analyst can develop. While traditional finance relies on central banks that can adjust money supply at will, crypto operates on transparent, coded issuance rules that dictate how many coins exist now — and how many will ever exist. In 2026, with institutional capital now flowing through Bitcoin ETFs, tokenized real-world assets surging, and AI-native tokens reshaping on-chain economies, mastering supply metrics has never been more critical.
This in-depth guide covers circulating supply, total supply, maximum supply, and fully diluted valuation (FDV) — explaining how each metric works, why it matters, and how to use them to evaluate scarcity, dilution risk, and long-term price potential.
Why Crypto Token Supply Matters in 2026
Token supply determines scarcity — a foundational driver of value in cryptocurrency markets. Bitcoin’s hard cap of 21 million coins anchors its narrative as ‘digital gold,’ while tokens with flexible or inflationary supply structures behave more like fiat currencies. But supply mechanics go far beyond a single number.
As institutional investors now dominate capital flows — largely limiting their exposure to Bitcoin and Ethereum — and as tokenized real-world assets (RWAs) have grown from roughly $5.6 billion to nearly $19 billion in a single year, the ability to decode a token’s supply structure is essential for distinguishing genuine value from engineered scarcity.
Understanding token supply helps investors answer four critical questions:
- Is the asset genuinely scarce, or is inflation baked into its design?
- How much supply is locked, vested, burned, or held by insiders?
- What is the true market cap versus the fully diluted valuation (FDV)?
- When will locked tokens unlock, and how much selling pressure will that create?
A token trading at $0.50 may look cheap — but with a billion-token supply and 85% still locked for team and investors, its FDV may already be enormous. Binance Research estimates that $155 billion worth of tokens will unlock between 2024 and 2030, creating sustained supply pressure across the market.
What Is Crypto Token Supply?
Crypto token supply refers to the number of coins that exist at a given time, determined by the coin’s issuance schedule, mining or minting rules, and on-chain smart contracts. There are four key supply metrics every investor should understand:
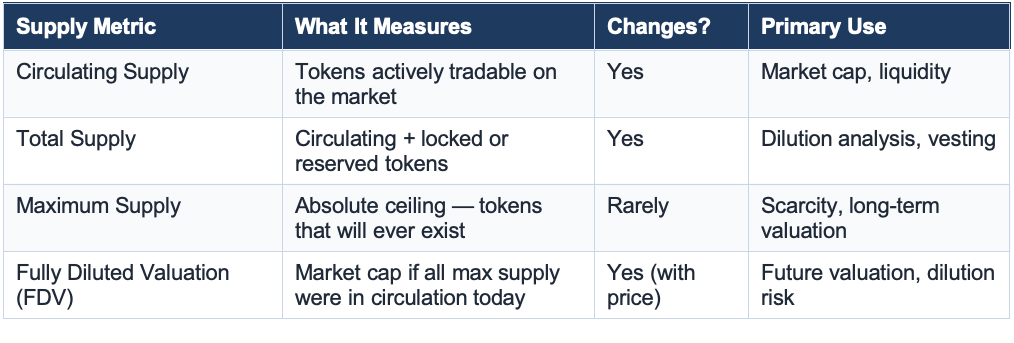
Each metric tells a different part of the story. Used together, they give a complete picture of a token’s economic design and future risks.
Circulating Supply: The Core Market Metric
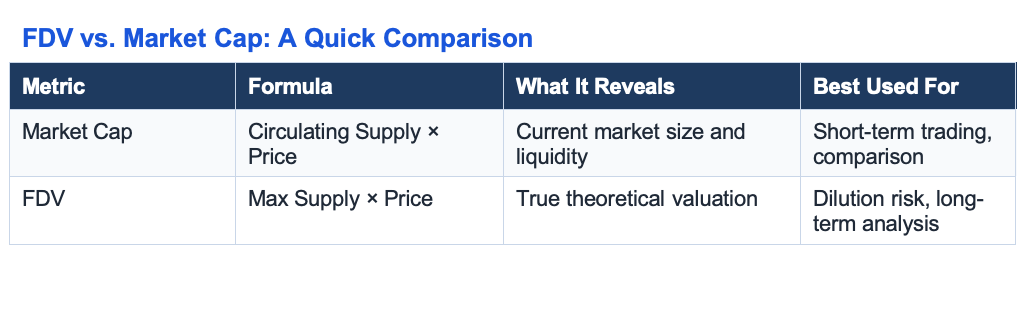
Circulating supply is the number of tokens currently available to buy, sell, and trade. It is the key input for market capitalization:
Market Cap = Circulating Supply × Token Price
However, circulating supply is never perfectly precise. It may include lost coins (like Satoshi Nakamoto’s early BTC wallets, untouched for over a decade), tokens locked by court orders, and dormant wallets that may never be accessed again. Despite these edge cases, it remains the best proxy for a token’s active economy.
How Circulating Supply Changes
Circulating supply is dynamic. It increases through mining, minting, staking rewards, and vesting unlocks. It decreases through token burns, buybacks, and redistribution. Bitcoin adds supply slowly through programmatic mining; some centralized tokens can mint new coins almost instantly — an important risk factor investors must evaluate.
Why Circulating Supply Matters
- Drives price discovery on exchanges
- Low-supply tokens experience higher volatility on the same dollar volume
- Determines the ‘real-time’ network valuation via market cap
- Enables fair comparison between assets with different price points
Maximum Supply: The Ceiling of Scarcity
Maximum supply defines the absolute cap on how many tokens will ever exist. Not all blockchains have one, but for those that do, it is typically coded at genesis and enforced cryptographically — making it immutable without a protocol-level governance vote.
| 2026 Update: Polkadot Introduces a Supply CapIn March 2026, Polkadot rolled out a major tokenomics upgrade, capping DOT supply at 2.1 billion tokens. Emissions were cut by 53.6% in the first phase, and treasury burns were replaced with a permanent on-chain governance account. This is a live example of how even established networks evolve their supply structures — and why investors must monitor tokenomics changes actively, not just at launch. |
What Happens When Max Supply Is Reached?
- Scarcity increases — often creating upward price pressure if demand holds
- Miners or validators shift to relying entirely on transaction fees
- The network transitions from inflationary to neutral or deflationary
Bitcoin illustrates this perfectly. Halving events occur roughly every four years, cutting the block reward in half. By 2140, all 21 million BTC will have been issued and miners will rely solely on transaction fees. Each halving has historically preceded significant price appreciation cycles.
Total Supply: The Middle-Ground Metric
Total supply measures all tokens that currently exist — both tradable and locked. It includes tokens held in smart contracts, reserved for staking rewards, allocated to teams or treasuries, and not yet released to the public. It excludes burned tokens.
Total supply matters because it reveals how much supply could eventually enter the market. A project with 20 million circulating tokens and 200 million total supply is signaling that 90% of its economy is still locked — and will unlock over time.
Key signals from total supply:
- High total vs. circulating supply ratio signals future dilution risk
- Upcoming vesting unlocks may trigger selling pressure
- Large treasury and team allocations require scrutiny of lock-up periods
Fully Diluted Valuation (FDV): The Metric Most Investors Overlook
Fully Diluted Valuation (FDV) is what the entire project would be worth if every token in its maximum supply were already in circulation at today’s price. Think of market cap as the slice of pie being eaten today, and FDV as the value of the whole pie — including everything still baking in the oven.
FDV = Maximum Supply × Current Token Price
FDV has become increasingly critical as many projects launch with only 10% to 15% of their total supply circulating. This can create the illusion of an early-stage opportunity when, in reality, insiders and venture capital funds hold the vast majority of tokens, waiting for their vesting periods to end.
The FDV/Market Cap Ratio: A Red Flag Indicator
The FDV-to-market cap ratio reveals how much future supply is still pending release. A ratio of 10:1 means 90% of tokens haven’t entered circulation yet. Many analysts today flag projects with FDV/market cap ratios above 5–8x as high-risk, because:
- Insiders are often incentivized to sell when vesting ends, especially if the project hasn’t met its growth targets
- A low circulating supply can create artificially low market caps, misleading investors about true valuation
- Large 3–5 year vesting schedules produce constant daily selling pressure
| Key Data Point$155 billion worth of tokens are estimated to unlock between 2024 and 2030 (Binance Research). This massive, multi-year supply overhang is one of the most underappreciated structural risks in the current crypto market cycle. |
FDV vs. Market Cap: A Quick Comparison
Token Supply Dynamics: Inflation, Deflation & Burns
Token supply systems follow distinct economic models that directly affect price behavior:
1. Inflationary Tokens
New coins are continuously minted or mined. Dogecoin, for example, has no supply cap and adds approximately 5 billion new DOGE per year. Inflationary tokens rely entirely on demand growth to maintain price stability — a difficult bar to clear at scale.
2. Deflationary Tokens
Tokens are periodically or continuously burned, permanently reducing supply. BNB undergoes quarterly auto-burns. Ethereum became deflationary after EIP-1559 introduced fee burns — during high-activity periods, ETH burns can exceed new issuance, making the network net-deflationary. Deflation creates structural upward pressure on price when demand is stable or rising.
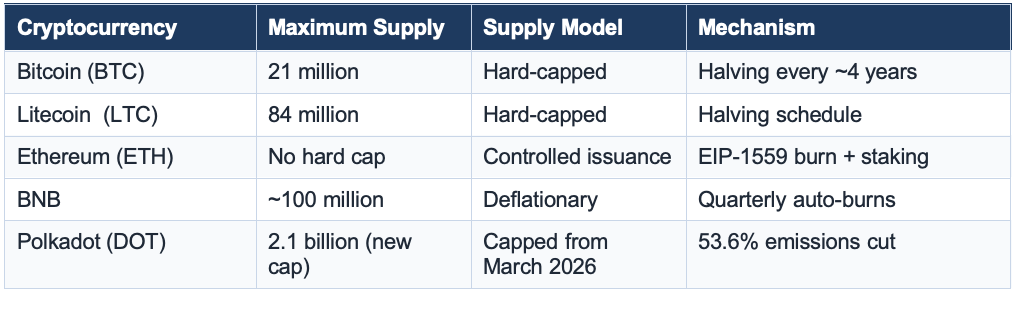
3. Hard-Capped Tokens
Once maximum supply is reached, no new coins are ever issued. Bitcoin is the defining example, with its supply architecture making it the most credibly scarce digital asset in existence.
4. Algorithmic Supply Models
Supply expands or contracts algorithmically to maintain a target price. This model collapsed spectacularly with TerraUSD in 2022 — the most high-profile tokenomics failure in crypto history — and remains a cautionary example of over-engineering supply mechanics without robust demand backing.
5. Governance-Adjusted Supply (Emerging in 2026)
An emerging trend in 2026 sees DAOs and protocol governance bodies voting to adjust emission rates, unlock schedules, and supply caps in real time. Polkadot’s March 2026 supply cap introduction is a leading example. Investors must now monitor governance forums — not just launch documents — to stay ahead of supply changes.
How Token Supply Affects Price and Market Behavior
Supply metrics don’t just describe a token’s economy — they drive investor expectations and frequently predict price movements. Here’s how each metric correlates with market behavior:
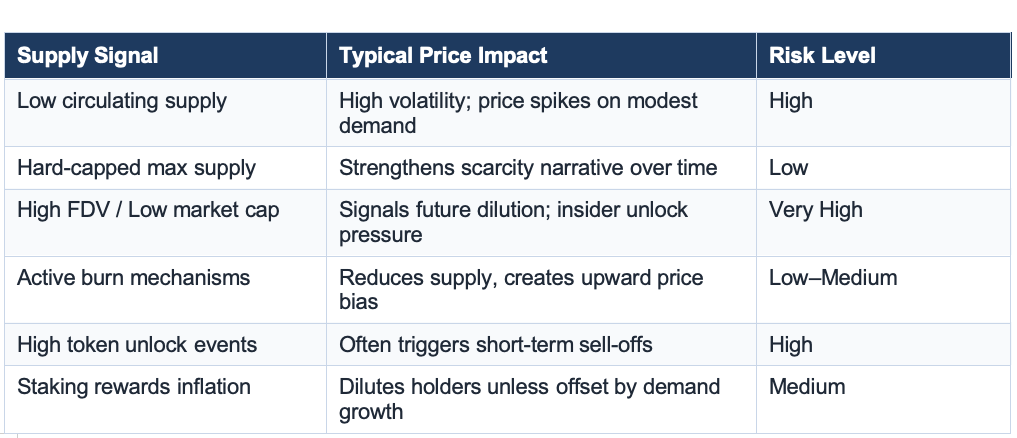
Projects launching in 2026 with only 2–5% of supply in circulation at Token Generation Events (TGEs) have been widely criticized for creating artificial scarcity. Market data confirms that price drops occur in 85% of new tokens post-TGE, often because early investors sell as soon as vesting unlocks. Experienced investors now scrutinize TGE circulating supply ratios before committing capital.
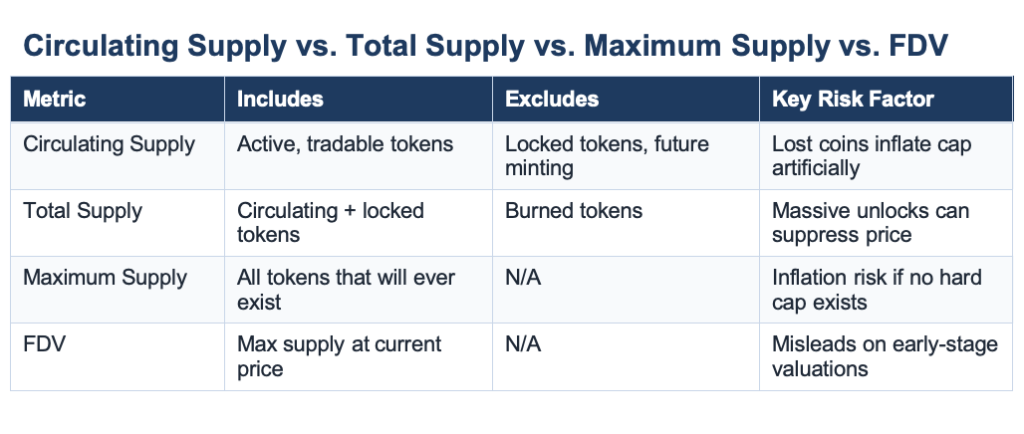
Circulating Supply vs. Total Supply vs. Maximum Supply vs. FDV
2026 Tokenomics Trends Investors Must Know
AI Agent Tokens and Machine-to-Machine Tokenomics
One of the most significant developments in 2026 is the rise of AI-native tokens. New AI projects increasingly launch with tokens that enable automated agents to hold assets, pay for services, and receive rewards autonomously — creating entirely new supply and demand dynamics that traditional circulating/max supply models don’t fully capture. Token standards are rapidly evolving to support instant micropayments and machine-to-machine interactions.
Real-World Asset (RWA) Tokenization
Tokenized financial assets have expanded dramatically, covering not just Treasury bills but commodities, private credit, and public equities. This growth creates new supply structures and on-chain liquidity pools that interact with crypto token economies in novel ways. Traditional institutions are building their own chains for RWA settlement, introducing more complex tokenomics frameworks than the market has seen before.
MiCA and Regulatory Compliance Shaping Supply Design
European regulation under MiCA and new stablecoin standards are forcing token issuers to treat supply design as a compliance matter — not just an economic one. Token classification, disclosure requirements around supply and governance, and KYC/AML at regulated fiat ramps are now baseline expectations for serious token launches in 2026.
Institutional Demand Concentrating on Hard-Capped Assets
As institutional capital — flowing through Bitcoin ETFs, digital asset treasury companies, and regulated funds — dominates market movements, the premium on cryptographically enforced scarcity is growing. Institutions are largely limiting scope to assets that meet institutional standards, reinforcing the narrative around hard-capped supply models like Bitcoin’s.
Why Investors Must Track Token Supply Continuously
Token supply is not static. Projects update their supply mechanics through protocol upgrades, token burns, new minting events, and governance votes. Tracking these changes in real time is essential for:
- Evaluating real-time inflation or deflation rates
- Anticipating unlock schedules that may cause selling pressure
- Assessing token distribution fairness and insider concentration
- Monitoring governance votes that could change emission rates or supply caps
- Verifying FDV calculations after burns or mint events adjust maximum supply
Tools like CoinGecko, CoinMarketCap, Messari, and on-chain data platforms (Glassnode, Token Unlocks, Nansen) provide live supply data. For governance-driven supply changes, following project Discord channels, Snapshot governance portals, and developer forums is increasingly necessary.
Token Supply Is the Foundation of Crypto Value
Circulating supply, total supply, maximum supply, and fully diluted valuation form the complete framework of crypto tokenomics. Each metric reveals a different dimension of a project’s economic design — from real-time market cap and liquidity to long-term scarcity and dilution risk.
In 2026’s maturing market — where $155 billion in scheduled token unlocks, AI-native supply mechanics, RWA tokenization, and institutional selectivity are reshaping how value flows — a clear understanding of supply dynamics is no longer optional. It’s the foundation of every sound investment thesis.
Whether you’re evaluating a new token launch, comparing established projects, or modeling long-term price trajectories, always start here: How many tokens exist today? How many will ever exist? And who holds the ones that haven’t been released yet?
Disclaimer: The information in this article is for general purposes only and does not constitute financial advice. The author’s views are personal and may not reflect the views of Chain Affairs. Before making any investment decisions, you should always conduct your own research. Chain Affairs is not responsible for any financial losses.
I’m your translator between the financial Old World and the new frontier of crypto. After a career demystifying economics and markets, I enjoy elucidating crypto – from investment risks to earth-shaking potential. Let’s explore!