
|
Getting your Trinity Audio player ready...
|
As cryptocurrency adoption continues to rise, the need to understand the underlying Metrics behind digital assets becomes increasingly important. Cryptocurrencies have revolutionized financial transactions, offering decentralized, borderless, and secure alternatives to traditional finance. But for those new to the world of crypto, the complex metrics used to assess these digital assets can be overwhelming.
If you’re considering investing in cryptocurrencies or simply want to better understand how they work, it’s essential to grasp some of the key metrics used to evaluate them. In this guide, we’ll break down the most common cryptocurrency metrics and explain how they can inform your investment decisions.
Market Capitalization
Market capitalization (or market cap) is a critical metric that indicates the total value of a cryptocurrency. It is calculated by multiplying the current price of one unit of a cryptocurrency by the total number of coins or tokens in circulation.
For example, if a cryptocurrency is priced at $10,000 per coin and there are 20 million coins in circulation, the market capitalization would be $200 billion. This metric provides a snapshot of the overall size of the cryptocurrency market and helps investors gauge whether a cryptocurrency is overvalued or undervalued relative to others. Higher market cap cryptocurrencies like Bitcoin and Ethereum are generally considered more stable, while lower market cap assets may carry higher risks but offer greater growth potential.
Also Read: Crypto Derivatives – Futures and Perpetual Contracts Explained
Funding Rates
Funding rates are payments made between traders in the perpetual futures market to keep the contract price aligned with the asset’s spot price. Unlike traditional futures contracts, perpetual futures do not have an expiration date, so traders can hold positions indefinitely, provided they pay funding rates.
Funding rates serve as an indicator of trader sentiment. Positive funding rates mean that long positions are dominant, and traders in long positions are paying short traders to hold their positions. Conversely, negative funding rates indicate that short positions are more prevalent, and short traders are paying long traders.
Monitoring funding rates can give you insight into market sentiment and trends, especially in highly leveraged markets where traders take on significant risk.
Open Interest
Open interest refers to the total number of outstanding derivative contracts (futures or options) that have not been settled. It is a useful indicator of market activity and liquidity, as rising open interest suggests that new capital is flowing into the market, while declining open interest can signal that money is leaving.
Open interest is a volume-based indicator that provides a snapshot of how much interest there is in a particular cryptocurrency. When paired with price action, it can give insights into market strength. For example, increasing prices alongside rising open interest typically indicate a strong bullish trend, while declining open interest with rising prices could suggest a weakening trend.
Stablecoin Flows
Stablecoin flows track the movement of stablecoins (like USDT, USDC, or DAI) into and out of exchanges. Since stablecoins are often used as a refuge during periods of volatility, monitoring their flows can provide insights into investor sentiment.
When large amounts of stablecoins are flowing into exchanges, it may indicate that investors are preparing to buy cryptocurrencies, signaling bullish sentiment. Conversely, outflows of stablecoins from exchanges suggest that traders are seeking to exit positions or are converting their assets into safer, fiat-backed alternatives, indicating bearish sentiment.
Exchange Flows
Exchange flows refer to the movement of cryptocurrencies into and out of centralized exchanges. Tracking these flows can help investors understand whether there is a net accumulation or selling of assets in the market.
There are three key metrics related to exchange flows:
- Inflow: Cryptocurrencies moving into an exchange, which can signal increased selling pressure.
- Outflow: Cryptocurrencies moving out of an exchange, often indicating accumulation and long-term holding.
- Net flow: The difference between inflows and outflows, providing an overall picture of market sentiment.
Fear & Greed Index
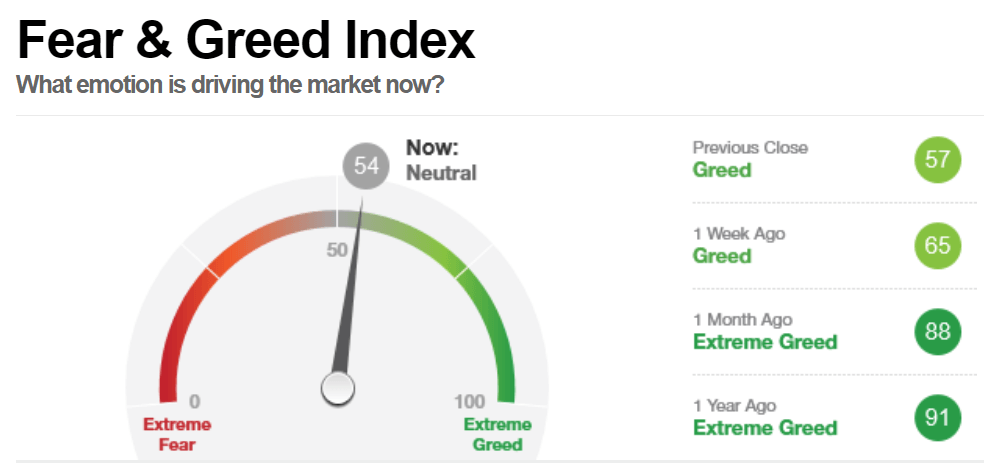
The Fear & Greed Index is a popular tool that gauges market sentiment, reflecting whether investors are feeling overly optimistic (greed) or fearful (fear). It is calculated based on factors like volatility, trading volume, social media activity, and market dominance.
A high score (closer to 100) indicates greed and suggests that the market may be overbought, while a low score (closer to 0) indicates fear and may signal that the market is oversold. This index helps investors gauge emotional sentiment and decide whether to buy or sell based on broader market psychology.
Network Value to Transactions (NVT) Ratio
The Network Value to Transactions (NVT) ratio is akin to the price-to-earnings (P/E) ratio in traditional finance. It compares a cryptocurrency’s market capitalization to the volume of transactions being conducted on its blockchain.
A high NVT ratio indicates that the market cap is growing faster than the network’s usage, which can suggest overvaluation. A low NVT ratio suggests that transaction volume is growing faster than market cap, potentially indicating undervaluation.
Realized Capitalization
Realized capitalization (realized cap) is an alternative metric to market capitalization. It calculates the value of each coin in circulation based on the price at which it was last moved rather than its current price.
This metric accounts for the impact of lost or long-dormant coins, providing a more accurate representation of the active value within a cryptocurrency network. For example, if Bitcoin held in a cold wallet since 2010 is finally moved today, its realized cap would be updated to reflect the price of Bitcoin at the time of the transfer.
Bitcoin Heat Map
The Bitcoin heat map is a visual tool that highlights price patterns based on historical data, specifically focusing on the relationship between Bitcoin’s price and its 200-week moving average (MA).
This indicator helps long-term investors identify cyclical trends in Bitcoin’s price. When Bitcoin’s price approaches or drops below the 200-week MA (indicated by purple on the heat map), it often signals a good buying opportunity. Conversely, when prices significantly exceed this moving average (indicated by red or orange), it may signal overbought conditions and potential for a correction.
Bitcoin Rainbow Chart
The Bitcoin Rainbow Chart uses color-coded bands to show Bitcoin’s price relative to different thresholds. These bands, ranging from “Fire Sale” to “HODL” and “Bubble Territory,” offer investors a way to visually assess when Bitcoin might be at a favorable or unfavorable buying point.
Although the Rainbow Chart is not intended as a precise trading signal, it is useful for spotting long-term trends and cycles in Bitcoin’s price history.
On-Balance Volume (OBV)
On-Balance Volume (OBV) is a technical indicator that tracks the flow of volume in and out of an asset. It is calculated by adding the volume on days when the price increases and subtracting the volume on days when the price decreases.
This metric helps traders assess buying and selling pressure. A rising OBV indicates strong buying interest, while a declining OBV suggests that selling pressure is dominant. OBV is especially useful for spotting divergences between price and volume, which can signal a potential reversal.
Accumulation/Distribution Line
The Accumulation/Distribution Line is a volume-based indicator that tracks the relationship between price and volume to determine whether a cryptocurrency is being accumulated (bought) or distributed (sold).
A rising accumulation/distribution line suggests that the asset is being accumulated, while a falling line indicates distribution. This tool is helpful in identifying whether the market is in a bullish or bearish phase and spotting potential trend reversals.
Average Directional Index (ADX)
The Average Directional Index (ADX) measures the strength of a trend, whether it’s upward or downward. The ADX typically includes two additional indicators: the Positive Directional Indicator (+DI) and the Negative Directional Indicator (-DI).
Traders use the ADX to assess whether they should trade with the trend or avoid trading altogether. A strong trend is indicated when the ADX is above 25, while values below 20 suggest that the market is ranging or weakly trending.
Moving Average Convergence-Divergence (MACD)
The Moving Average Convergence-Divergence (MACD) is a popular trend-following indicator that shows the relationship between two moving averages of an asset’s price. It consists of a MACD line, signal line, and histogram.
When the MACD crosses above the signal line, it is a bullish signal, while crossing below is bearish. The histogram visualizes the difference between the MACD line and the signal line, helping traders assess the strength of the trend.
Relative Strength Index (RSI)
The Relative Strength Index (RSI) is a momentum oscillator that measures the speed and change of price movements. It ranges from 0 to 100, with values above 70 indicating overbought conditions and values below 30 indicating oversold conditions.
RSI is widely used to spot potential trend reversals or confirm ongoing trends, particularly when it diverges from the asset’s price.
Conclusion
Understanding cryptocurrency metrics is crucial for making informed investment decisions. Whether you’re tracking market cap to assess the overall size of a cryptocurrency or analyzing technical indicators like RSI or OBV for market timing, these metrics offer valuable insights into the health and future potential of digital assets. As you navigate the evolving world of cryptocurrencies, mastering these metrics will empower you to better analyze trends and manage your portfolio effectively.
Disclaimer: The information in this article is for general purposes only and does not constitute financial advice. The author’s views are personal and may not reflect the views of Chain Affairs. Before making any investment decisions, you should always conduct your own research. Chain Affairs is not responsible for any financial losses.
I’m a crypto enthusiast with a background in finance. I’m fascinated by the potential of crypto to disrupt traditional financial systems. I’m always on the lookout for new and innovative projects in the space. I believe that crypto has the potential to create a more equitable and inclusive financial system.