|
Getting your Trinity Audio player ready...
|
Key Takeaways:
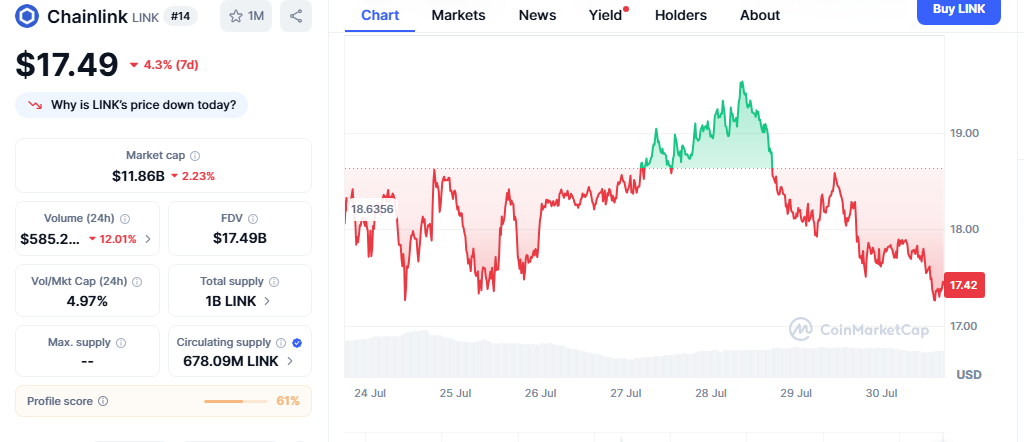
- Chainlink has dropped below $20 and is now trading near $17.33.
- Rising exchange inflows and bearish technicals point to further downside.
- Support at $14.98 is key; a break lower could push LINK toward $10.
Chainlink (LINK) has lost critical ground after failing to hold above $20, retreating to $17.33 as of press time. The 8.44% weekly decline signals that short-term bullish momentum has fully reversed. With multiple technical indicators and on-chain metrics turning bearish, the token may face more downside.
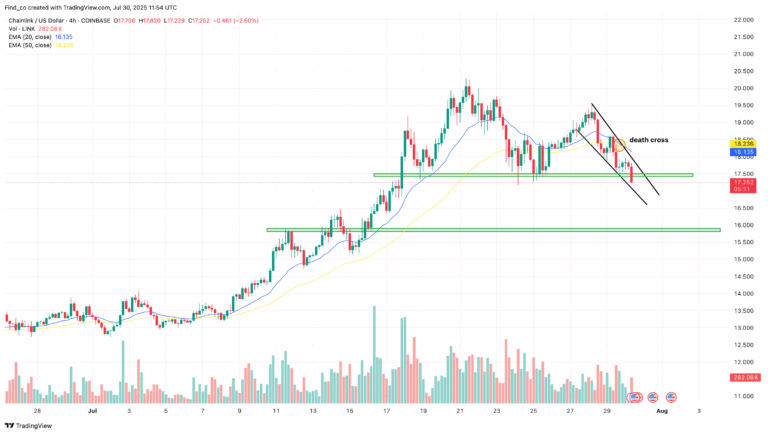
Downtrend Confirmed by Technical Patterns
After briefly joining the broader altcoin rally in early July, LINK has since fallen into a descending price channel. On the 4-hour chart, a “death cross” has emerged — where the 20-period Exponential Moving Average (EMA) crosses below the 50 EMA — suggesting sustained downward pressure.
Adding to the bearish setup, LINK has slipped below a key demand zone. If bulls fail to reclaim $20.49, the next major support lies at $15.90, with the possibility of a further drop to $14.98 or even $10 if bearish momentum accelerates.
Exchange Inflows Double, Indicating Selling Intent
Glassnode data reveals that LINK exchange inflows have more than doubled within days — from 848,890 to over 1.67 million LINK. This surge often signals increased selling pressure, and when paired with LINK’s current technical weakness, it may indicate that holders are preparing to offload.
Also Read: Chainlink (LINK) Poised for Rally as Whales Accumulate $28M and TVS Hits $52.3B
Daily MACD Signals Bearish Continuation
The daily Moving Average Convergence Divergence (MACD) indicator has crossed into negative territory, confirming a bearish crossover. This alignment further weakens LINK’s short-term outlook. Unless a bullish crossover occurs, the altcoin remains vulnerable to deeper price declines.
Chainlink’s failure to sustain key levels, combined with rising exchange inflows and negative technical patterns, paints a bearish near-term picture. While a bullish MACD reversal could offer a relief bounce toward $26.46, current momentum suggests sellers remain firmly in control.
Disclaimer: The information in this article is for general purposes only and does not constitute financial advice. The author’s views are personal and may not reflect the views of Chain Affairs. Before making any investment decisions, you should always conduct your own research. Chain Affairs is not responsible for any financial losses
I’m your translator between the financial Old World and the new frontier of crypto. After a career demystifying economics and markets, I enjoy elucidating crypto – from investment risks to earth-shaking potential. Let’s explore!