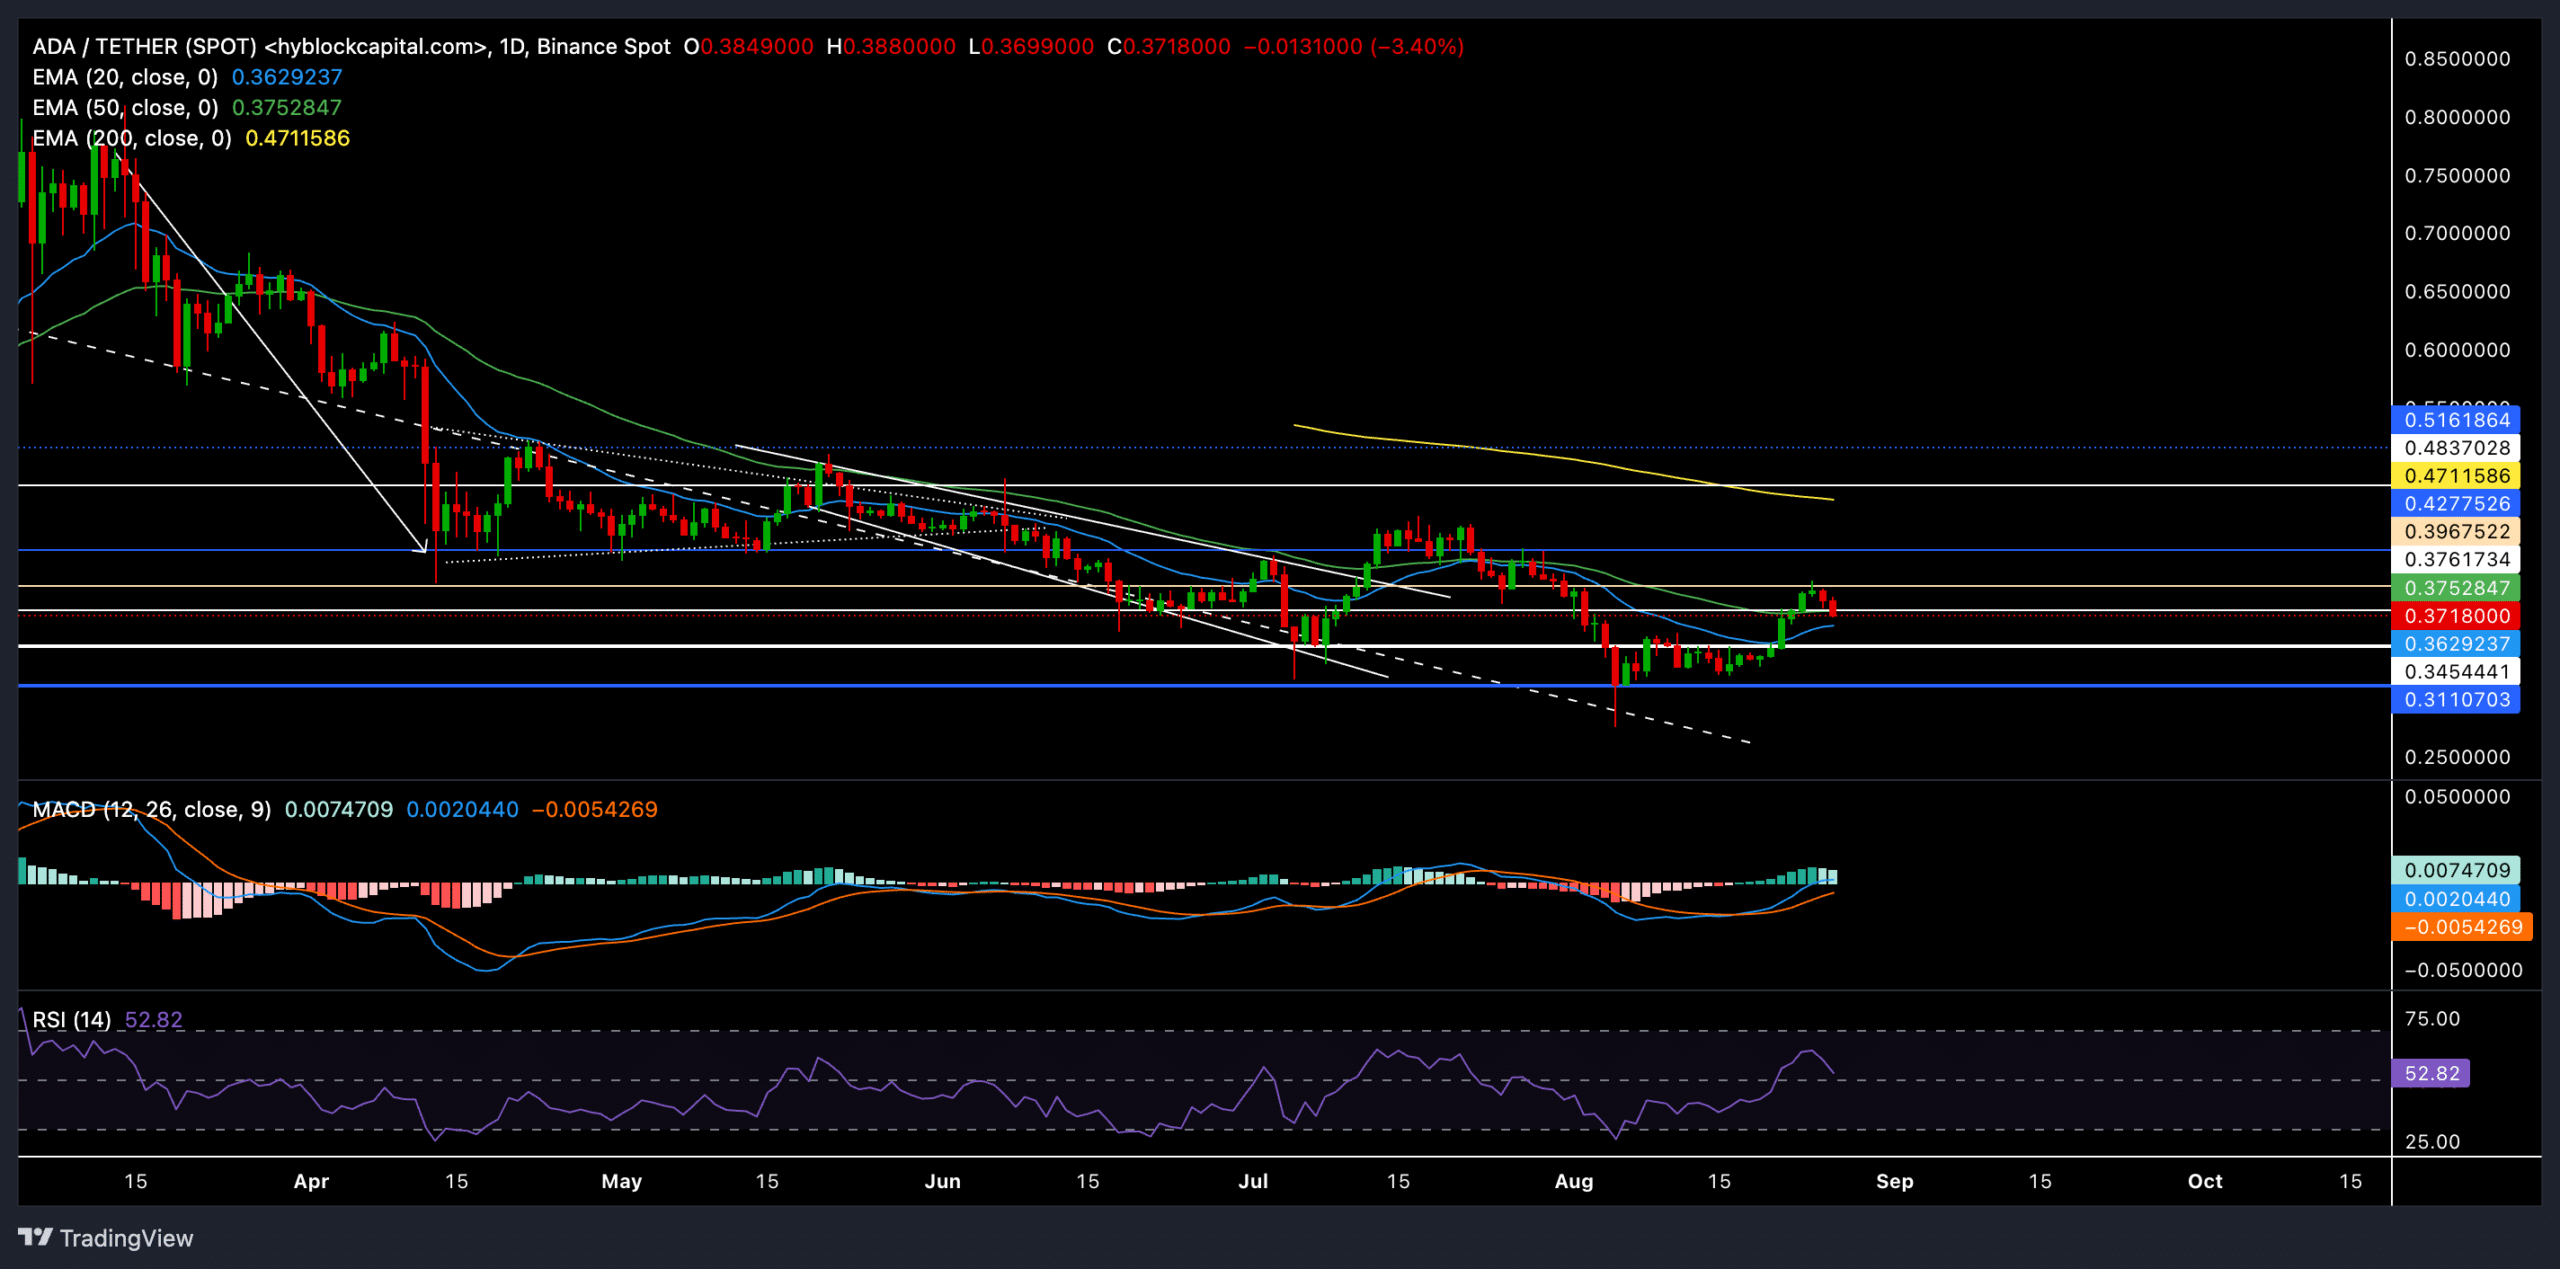
Cardano (ADA) has been facing challenges in the crypto market, recently encountering increased selling pressure near the $0.39 resistance level. Despite a slight improvement in broader market sentiment, ADA’s price has declined by nearly 5% in the past 24 hours, trading at $0.37 at press time.
Recent Price Action and Technical Indicators
Cardano’s recent price action has been characterized by a rebound from the $0.31 support level, followed by a failed attempt to break above the $0.39 resistance. While the price has briefly traded above the 20-day and 50-day Exponential Moving Averages (EMAs), the recent reversal has pushed it back below the 50-day EMA.

The 200-day EMA at $0.4711 remains a significant resistance level, indicating bearish dominance over the longer term. However, the MACD indicator has recently entered positive territory, suggesting that the immediate selling momentum may be slowing.
Bullish Potential and Key Levels to Watch
For Cardano to regain bullish momentum, it will need to find support at the 20-day EMA and retest the $0.39 resistance. A successful break above this level could pave the way for a recovery towards the 200-day EMA.
The Relative Strength Index (RSI) is hovering near equilibrium, and a bounce-off from the 50-mark could signal a potential recovery. However, a decline below this level could expose ADA to further downside.
Key support and resistance levels to watch:
- Immediate support: $0.375
- Resistance: $0.39
- Stronger resistance: $0.47 (200-day EMA)
Market Sentiment and Volume
The volume for Cardano has declined in the last 24 hours, indicating reduced trading activity. However, the open interest has increased slightly, suggesting that traders are still engaged in the market. The long/short ratio for the past 24 hours has been bearish, but on Binance, the ratio for ADA/USDT has been bullish.
Also Read: Max Maher Predicts Cardano (ADA) Price Surge – Why A 10x Rally Could Be On The Horizon
Overall, Cardano’s price outlook remains uncertain, with the potential for both upside and downside movements. Investors should closely monitor technical indicators and market sentiment for clues on the direction of the price.
Disclaimer: The information in this article is for general purposes only and does not constitute financial advice. The author’s views are personal and may not reflect the views of Chain Affairs. Before making any investment decisions, you should always conduct your own research. Chain Affairs is not responsible for any financial losses.


